

Question: Project Work: Project Work: IBM's Dividend Policy and shareholders' return do the below points 1. Analysis dividend and stock price history. 2. Using stock return
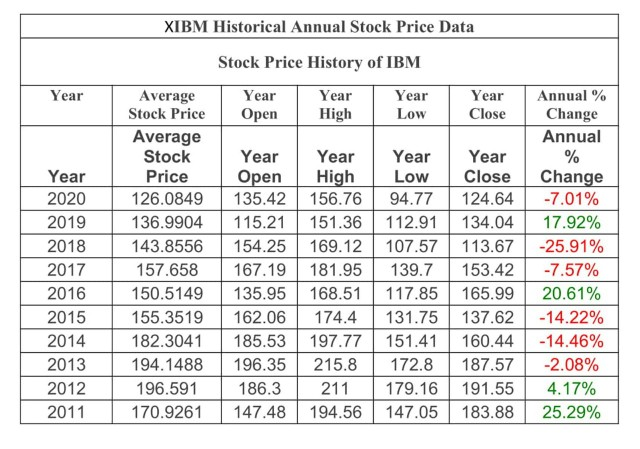
Project Work: Project Work: IBM's Dividend Policy and shareholders' return do the below points 1. Analysis dividend and stock price history. 2. Using stock return analysis , show shareholders' return over 1-10 years. Prepare chart explaining stock return for holding period of 1,2,...., 10 years. XIBM Historical Annual Stock Price Data Year Stock Price History of IBM Year Year Open High Low Year Year Close Year 2020 2019 2018 2017 2016 2015 2014 2013 2012 2011 Average Stock Price Average Stock Price 126.0849 136.9904 143.8556 157.658 150.5149 155.3519 182.3041 194.1488 196.591 170.9261 Year Year Open High 135.42 156.76 115.21 151.36 154.25 169.12 167.19 181.95 135.95 168.51 162.06 174.4 185.53 197.77 196.35 215.8 186.3 211 147.48 194.56 Year Low 94.77 112.91 107.57 139.7 117.85 131.75 151.41 172.8 179.16 147.05 Year Close 124.64 134.04 113.67 153.42 165.99 137.62 160.44 187.57 191.55 183.88 Annual % Change Annual % Change -7.01% 17.92% -25.91% -7.57% 20.61% -14.22% -14.46% -2.08% 4.17% 25.29% Project Work: Project Work: IBM's Dividend Policy and shareholders' return do the below points 1. Analysis dividend and stock price history. 2. Using stock return analysis , show shareholders' return over 1-10 years. Prepare chart explaining stock return for holding period of 1,2,...., 10 years. XIBM Historical Annual Stock Price Data Year Stock Price History of IBM Year Year Open High Low Year Year Close Year 2020 2019 2018 2017 2016 2015 2014 2013 2012 2011 Average Stock Price Average Stock Price 126.0849 136.9904 143.8556 157.658 150.5149 155.3519 182.3041 194.1488 196.591 170.9261 Year Year Open High 135.42 156.76 115.21 151.36 154.25 169.12 167.19 181.95 135.95 168.51 162.06 174.4 185.53 197.77 196.35 215.8 186.3 211 147.48 194.56 Year Low 94.77 112.91 107.57 139.7 117.85 131.75 151.41 172.8 179.16 147.05 Year Close 124.64 134.04 113.67 153.42 165.99 137.62 160.44 187.57 191.55 183.88 Annual % Change Annual % Change -7.01% 17.92% -25.91% -7.57% 20.61% -14.22% -14.46% -2.08% 4.17% 25.29%
Step by Step Solution
There are 3 Steps involved in it

Get step-by-step solutions from verified subject matter experts