

Question: Projected Financial Statements to include Income Statement, Balance Sheet, and Cash Flows for Walmart for years 2024, 2025, and 2026. Please cite sources that helped
Projected Financial Statements to include Income Statement, Balance Sheet, and Cash Flows for Walmart for years 2024, 2025, and 2026. Please cite sources that helped with estimates and past figures to help with projected financials. Please use the statements below to help prthe income statement, balance sheet, and cash flow for Walmart.
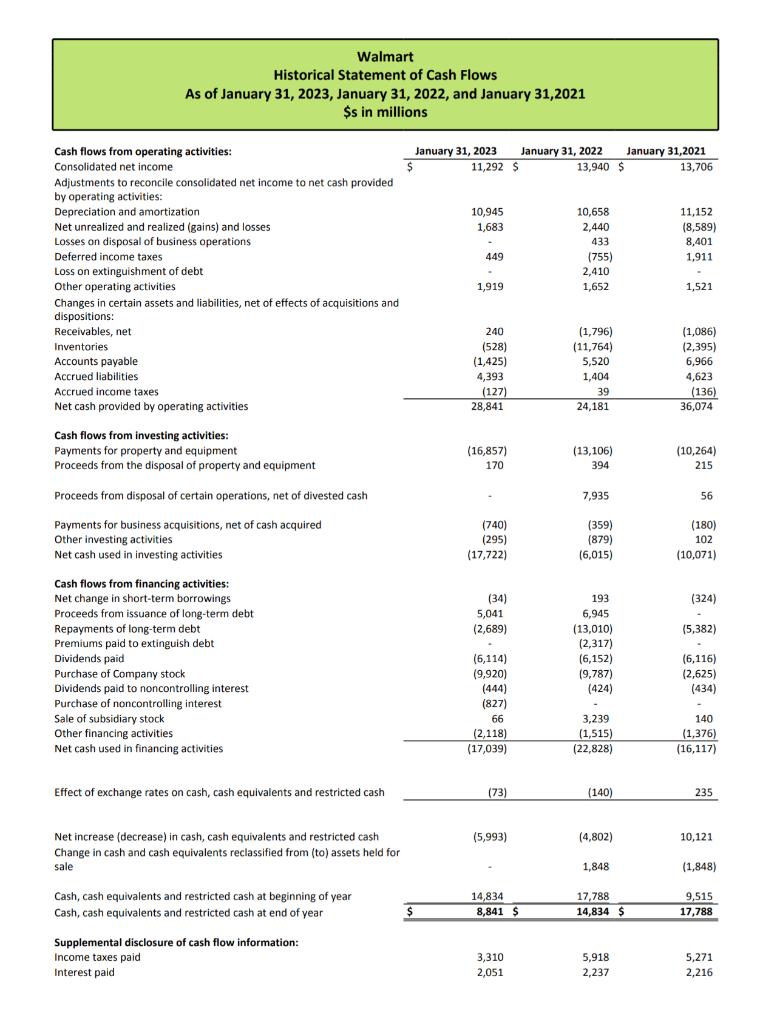
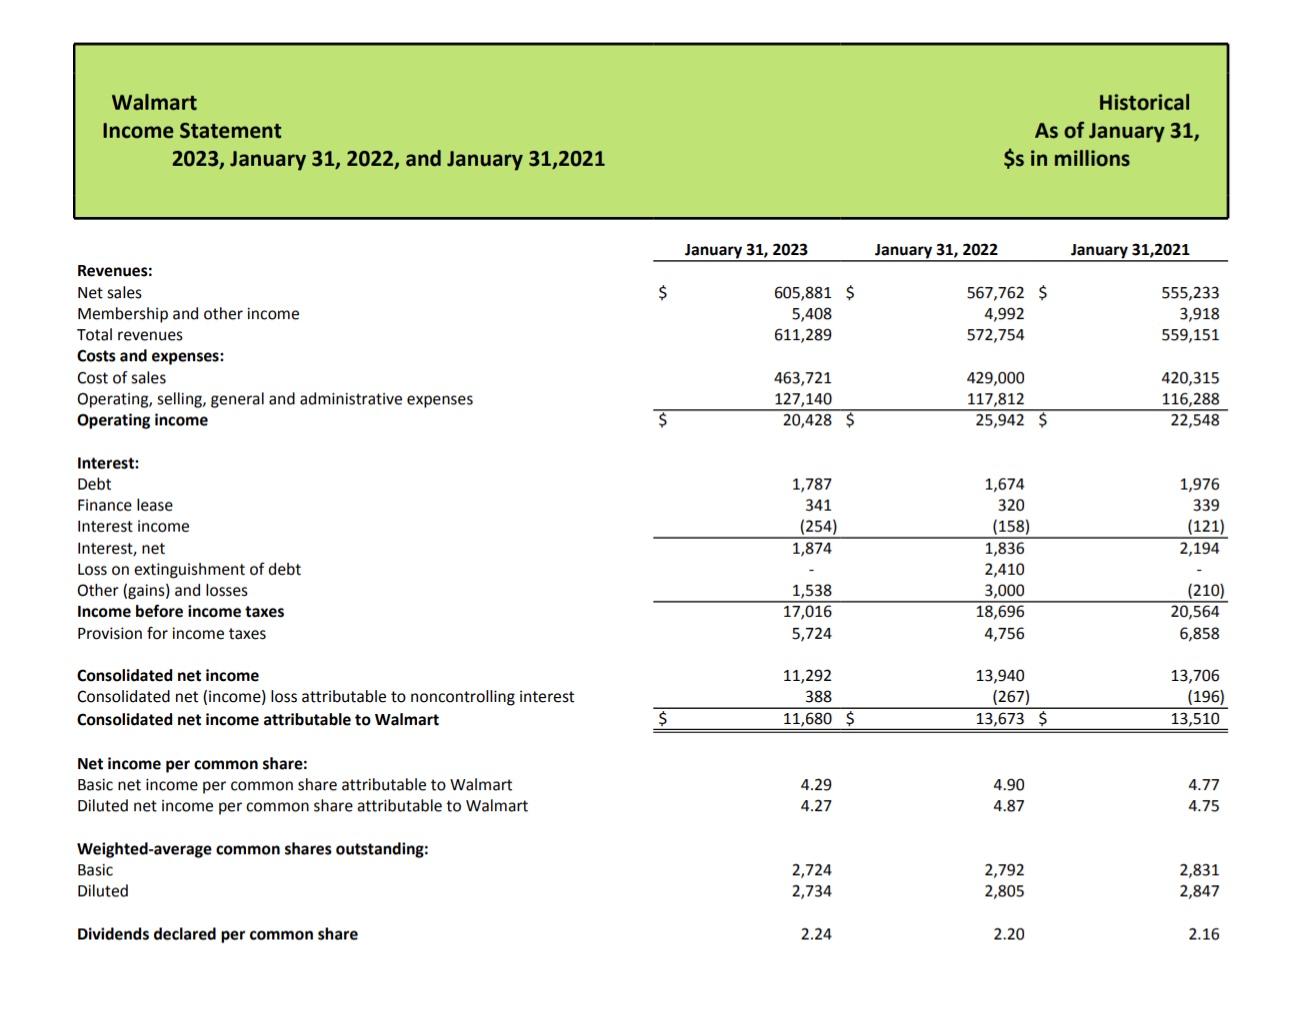
Walmart Historical Statement of Cash Flows As of January 31, 2023, January 31, 2022, and January 31,2021 \$s in millions Cash flows from operating activities: Consolidated net income \begin{tabular}{crrrr} January 31, 2023 & \multicolumn{2}{c}{ January 31,2022} & January 31,2021 \\ \hline$ & 11,292 & 13,940 & $ & 13,706 \end{tabular} Adjustments to reconcile consolidated net income to net cash provided by operating activities: Changes in certain assets and liabilities, net of effects of acquisitions and dispositions: Cash flows from investing activities: Payments for property and equipment Proceeds from the disposal of property and equipment Proceeds from disposal of certain operations, net of divested cash Payments for business acquisitions, net of cash acquired Other investing activities Net cash used in investing activities (16,857)170(740)(295)(17,722)(13,106)3947,935(359)(879)(6,015)(10,264)21556(180)102(10,071) Cash flows from financing activities: Net change in short-term borrowings Proceeds from issuance of long-term debt Repayments of long-term debt Premiums paid to extinguish debt Dividends paid Purchase of Company stock Dividends paid to noncontrolling interest Purchase of noncontrolling interest Sale of subsidiary stock Other financing activities Net cash used in financing activities \begin{tabular}{rcc} (34) & 193 & (324) \\ 5,041 & 6,945 & - \\ (2,689) & (13,010) & (5,382) \\ - & (2,317) & - \\ (6,114) & (6,152) & (6,116) \\ (9,920) & (9,787) & (2,625) \\ (444) & (424) & (434) \\ (827) & - & - \\ 66 & 3,239 & 140 \\ (2,118) & (1,515) & (1,376) \\ \hline(17,039) & (22,828) & (16,117) \end{tabular} Effect of exchange rates on cash, cash equivalents and restricted cash (73) (140) 235 Net increase (decrease) in cash, cash equivalents and restricted cash (5,993)(4,802)10,121 Change in cash and cash equivalents reclassified from (to) assets held for sale Cash, cash equivalents and restricted cash at beginning of year Cash, cash equivalents and restricted cash at end of year \begin{tabular}{rrrr} & 14,834 & 17,788 & 9,515 \\ \hline$ & 8,841 & 14,834$ & 17,788 \\ \hline \end{tabular} Supplemental disclosure of cash flow information: Income taxes paid Interest paid 3,3102,0515,9182,2375,2712,216 Walmart Historical Income Statement As of January 31, 2023, January 31, 2022, and January 31,2021 \$s in millions Revenues: Net sales Membership and other income Total revenues Costs and expenses: Cost of sales Operating, selling, general and administrative expenses Operating income Interest: Debt Finance lease Interest income Interest, net Loss on extinguishment of debt Other (gains) and losses Income before income taxes Provision for income taxes Consolidated net income Consolidated net (income) loss attributable to noncontrolling interest Consolidated net income attributable to Walmart \begin{tabular}{cccc} & 1,787 & 1,674 & 1,976 \\ 341 & 320 & 339 \\ (254) & (158) & (121) \\ \hline 1,874 & 1,836 & 2,194 \\ & - & 2,410 & - \\ & 1,538 & 3,000 & (210) \\ \hline 17,016 & 18,696 & 20,564 \\ & 5,724 & 4,756 & 6,858 \\ & & & \\ & 11,292 & 13,940 & 13,706 \\ 388 & (267) & (196) \\ \hline \hline & 13,673$ & 13,510 \\ \hline \hline \end{tabular} Net income per common share: Basic net income per common share attributable to Walmart Diluted net income per common share attributable to Walmart 4.294.274.904.874.774.75 Weighted-average common shares outstanding: Basic Diluted 2,7242,7342,7922,8052,8312,847 Dividends declared per common share 2.24 2.20 2.16 Walmart Historical Statement of Cash Flows As of January 31, 2023, January 31, 2022, and January 31,2021 \$s in millions Cash flows from operating activities: Consolidated net income \begin{tabular}{crrrr} January 31, 2023 & \multicolumn{2}{c}{ January 31,2022} & January 31,2021 \\ \hline$ & 11,292 & 13,940 & $ & 13,706 \end{tabular} Adjustments to reconcile consolidated net income to net cash provided by operating activities: Changes in certain assets and liabilities, net of effects of acquisitions and dispositions: Cash flows from investing activities: Payments for property and equipment Proceeds from the disposal of property and equipment Proceeds from disposal of certain operations, net of divested cash Payments for business acquisitions, net of cash acquired Other investing activities Net cash used in investing activities (16,857)170(740)(295)(17,722)(13,106)3947,935(359)(879)(6,015)(10,264)21556(180)102(10,071) Cash flows from financing activities: Net change in short-term borrowings Proceeds from issuance of long-term debt Repayments of long-term debt Premiums paid to extinguish debt Dividends paid Purchase of Company stock Dividends paid to noncontrolling interest Purchase of noncontrolling interest Sale of subsidiary stock Other financing activities Net cash used in financing activities \begin{tabular}{rcc} (34) & 193 & (324) \\ 5,041 & 6,945 & - \\ (2,689) & (13,010) & (5,382) \\ - & (2,317) & - \\ (6,114) & (6,152) & (6,116) \\ (9,920) & (9,787) & (2,625) \\ (444) & (424) & (434) \\ (827) & - & - \\ 66 & 3,239 & 140 \\ (2,118) & (1,515) & (1,376) \\ \hline(17,039) & (22,828) & (16,117) \end{tabular} Effect of exchange rates on cash, cash equivalents and restricted cash (73) (140) 235 Net increase (decrease) in cash, cash equivalents and restricted cash (5,993)(4,802)10,121 Change in cash and cash equivalents reclassified from (to) assets held for sale Cash, cash equivalents and restricted cash at beginning of year Cash, cash equivalents and restricted cash at end of year \begin{tabular}{rrrr} & 14,834 & 17,788 & 9,515 \\ \hline$ & 8,841 & 14,834$ & 17,788 \\ \hline \end{tabular} Supplemental disclosure of cash flow information: Income taxes paid Interest paid 3,3102,0515,9182,2375,2712,216 Walmart Historical Income Statement As of January 31, 2023, January 31, 2022, and January 31,2021 \$s in millions Revenues: Net sales Membership and other income Total revenues Costs and expenses: Cost of sales Operating, selling, general and administrative expenses Operating income Interest: Debt Finance lease Interest income Interest, net Loss on extinguishment of debt Other (gains) and losses Income before income taxes Provision for income taxes Consolidated net income Consolidated net (income) loss attributable to noncontrolling interest Consolidated net income attributable to Walmart \begin{tabular}{cccc} & 1,787 & 1,674 & 1,976 \\ 341 & 320 & 339 \\ (254) & (158) & (121) \\ \hline 1,874 & 1,836 & 2,194 \\ & - & 2,410 & - \\ & 1,538 & 3,000 & (210) \\ \hline 17,016 & 18,696 & 20,564 \\ & 5,724 & 4,756 & 6,858 \\ & & & \\ & 11,292 & 13,940 & 13,706 \\ 388 & (267) & (196) \\ \hline \hline & 13,673$ & 13,510 \\ \hline \hline \end{tabular} Net income per common share: Basic net income per common share attributable to Walmart Diluted net income per common share attributable to Walmart 4.294.274.904.874.774.75 Weighted-average common shares outstanding: Basic Diluted 2,7242,7342,7922,8052,8312,847 Dividends declared per common share 2.24 2.20 2.16
Step by Step Solution
There are 3 Steps involved in it

Get step-by-step solutions from verified subject matter experts