

Question: Projects, projects and workers'salaries! Q-Constructions has tasked you to investigate the number of construction projects per year for which the company would need to break-even
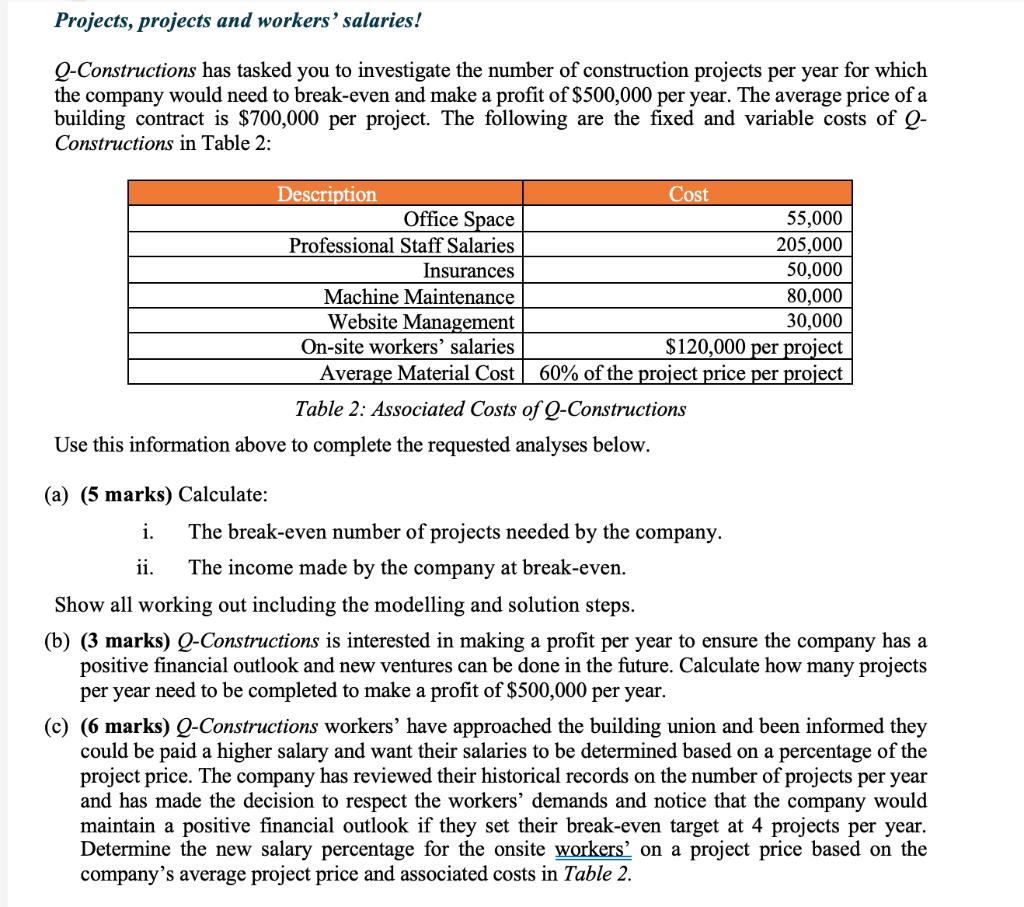
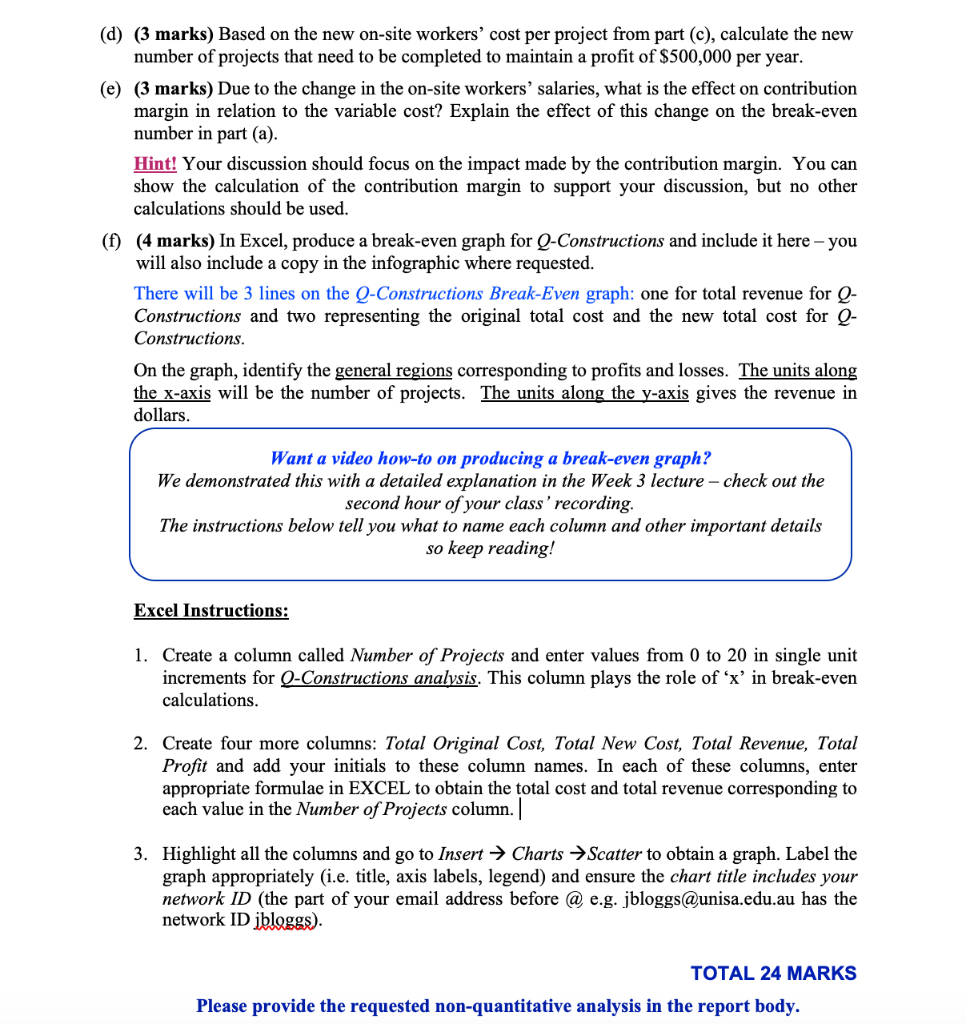
Projects, projects and workers'salaries! Q-Constructions has tasked you to investigate the number of construction projects per year for which the company would need to break-even and make a profit of $500,000 per year. The average price of a building contract is $700,000 per project. The following are the fixed and variable costs of Q- Constructions in Table 2: Description Cost Office Space 55,000 Professional Staff Salaries 205,000 Insurances 50,000 Machine Maintenance 80,000 Website Management 30,000 On-site workers' salaries $120,000 per project Average Material Cost 60% of the project price per project Table 2: Associated Costs of Q-Constructions Use this information above to complete the requested analyses below. (a) (5 marks) Calculate: i. The break-even number of projects needed by the company. ii. The income made by the company at break-even. Show all working out including the modelling and solution steps. (b) (3 marks) Q-Constructions is interested in making a profit per year to ensure the company has a positive financial outlook and new ventures can be done in the future. Calculate how many projects per year need to be completed to make a profit of $500,000 per year. (c) (6 marks) Q-Constructions workers' have approached the building union and been informed they could be paid a higher salary and want their salaries to be determined based on a percentage of the project price. The company has reviewed their historical records on the number of projects per year and has made the decision to respect the workers' demands and notice that the company would maintain a positive financial outlook if they set their break-even target at 4 projects per year. Determine the new salary percentage for the onsite workers' on a project price based on the company's average project price and associated costs in Table 2. (d) (3 marks) Based on the new on-site workers' cost per project from part (c), calculate the new number of projects that need to be completed to maintain a profit of $500,000 per year. (e) (3 marks) Due to the change in the on-site workers' salaries, what is the effect on contribution margin in relation to the variable cost? Explain the effect of this change on the break-even number in part (a). Hint! Your discussion should focus on the impact made by the contribution margin. You can show the calculation of the contribution margin to support your discussion, but no other calculations should be used. (f) (4 marks) In Excel, produce a break-even graph for Q-Constructions and include it here - you will also include a copy in the infographic where requested. There will be 3 lines on the Q-Constructions Break-Even graph: one for total revenue for Q- Constructions and two representing the original total cost and the new total cost for Q- Constructions. On the graph, identify the general regions corresponding to profits and losses. The units along the x-axis will be the number of projects. The units along the y-axis gives the revenue in dollars. Want a video how-to on producing a break-even graph? We demonstrated this with a detailed explanation in the Week 3 lecture - check out the second hour of your class' recording. The instructions below tell you what to name each column and other important details so keep reading! Excel Instructions: 1. Create a column called Number of Projects and enter values from 0 to 20 in single unit increments for Q-Constructions analysis. This column plays the role of 'x' in break-even calculations. 2. Create four more columns: Total Original Cost, Total New Cost, Total Revenue, Total Profit and add your initials to these column names. In each of these columns, enter appropriate formulae in EXCEL to obtain the total cost and total revenue corresponding to each value in the Number of Projects column. 3. Highlight all the columns and go to Insert Charts Scatter to obtain a graph. Label the graph appropriately (i.e. title, axis labels, legend) and ensure the chart title includes your network ID (the part of your email address before @ e.g. jbloggs@unisa.edu.au has the network ID jbloggs). TOTAL 24 MARKS Please provide the requested non-quantitative analysis in the report body. Projects, projects and workers'salaries! Q-Constructions has tasked you to investigate the number of construction projects per year for which the company would need to break-even and make a profit of $500,000 per year. The average price of a building contract is $700,000 per project. The following are the fixed and variable costs of Q- Constructions in Table 2: Description Cost Office Space 55,000 Professional Staff Salaries 205,000 Insurances 50,000 Machine Maintenance 80,000 Website Management 30,000 On-site workers' salaries $120,000 per project Average Material Cost 60% of the project price per project Table 2: Associated Costs of Q-Constructions Use this information above to complete the requested analyses below. (a) (5 marks) Calculate: i. The break-even number of projects needed by the company. ii. The income made by the company at break-even. Show all working out including the modelling and solution steps. (b) (3 marks) Q-Constructions is interested in making a profit per year to ensure the company has a positive financial outlook and new ventures can be done in the future. Calculate how many projects per year need to be completed to make a profit of $500,000 per year. (c) (6 marks) Q-Constructions workers' have approached the building union and been informed they could be paid a higher salary and want their salaries to be determined based on a percentage of the project price. The company has reviewed their historical records on the number of projects per year and has made the decision to respect the workers' demands and notice that the company would maintain a positive financial outlook if they set their break-even target at 4 projects per year. Determine the new salary percentage for the onsite workers' on a project price based on the company's average project price and associated costs in Table 2. (d) (3 marks) Based on the new on-site workers' cost per project from part (c), calculate the new number of projects that need to be completed to maintain a profit of $500,000 per year. (e) (3 marks) Due to the change in the on-site workers' salaries, what is the effect on contribution margin in relation to the variable cost? Explain the effect of this change on the break-even number in part (a). Hint! Your discussion should focus on the impact made by the contribution margin. You can show the calculation of the contribution margin to support your discussion, but no other calculations should be used. (f) (4 marks) In Excel, produce a break-even graph for Q-Constructions and include it here - you will also include a copy in the infographic where requested. There will be 3 lines on the Q-Constructions Break-Even graph: one for total revenue for Q- Constructions and two representing the original total cost and the new total cost for Q- Constructions. On the graph, identify the general regions corresponding to profits and losses. The units along the x-axis will be the number of projects. The units along the y-axis gives the revenue in dollars. Want a video how-to on producing a break-even graph? We demonstrated this with a detailed explanation in the Week 3 lecture - check out the second hour of your class' recording. The instructions below tell you what to name each column and other important details so keep reading! Excel Instructions: 1. Create a column called Number of Projects and enter values from 0 to 20 in single unit increments for Q-Constructions analysis. This column plays the role of 'x' in break-even calculations. 2. Create four more columns: Total Original Cost, Total New Cost, Total Revenue, Total Profit and add your initials to these column names. In each of these columns, enter appropriate formulae in EXCEL to obtain the total cost and total revenue corresponding to each value in the Number of Projects column. 3. Highlight all the columns and go to Insert Charts Scatter to obtain a graph. Label the graph appropriately (i.e. title, axis labels, legend) and ensure the chart title includes your network ID (the part of your email address before @ e.g. jbloggs@unisa.edu.au has the network ID jbloggs). TOTAL 24 MARKS Please provide the requested non-quantitative analysis in the report body
Step by Step Solution
There are 3 Steps involved in it

Get step-by-step solutions from verified subject matter experts