

Question: Provide a chart showing Quarter 1 data as follows: a . Copy the Q 2 Sales chart. b . Paste the chart in cell A
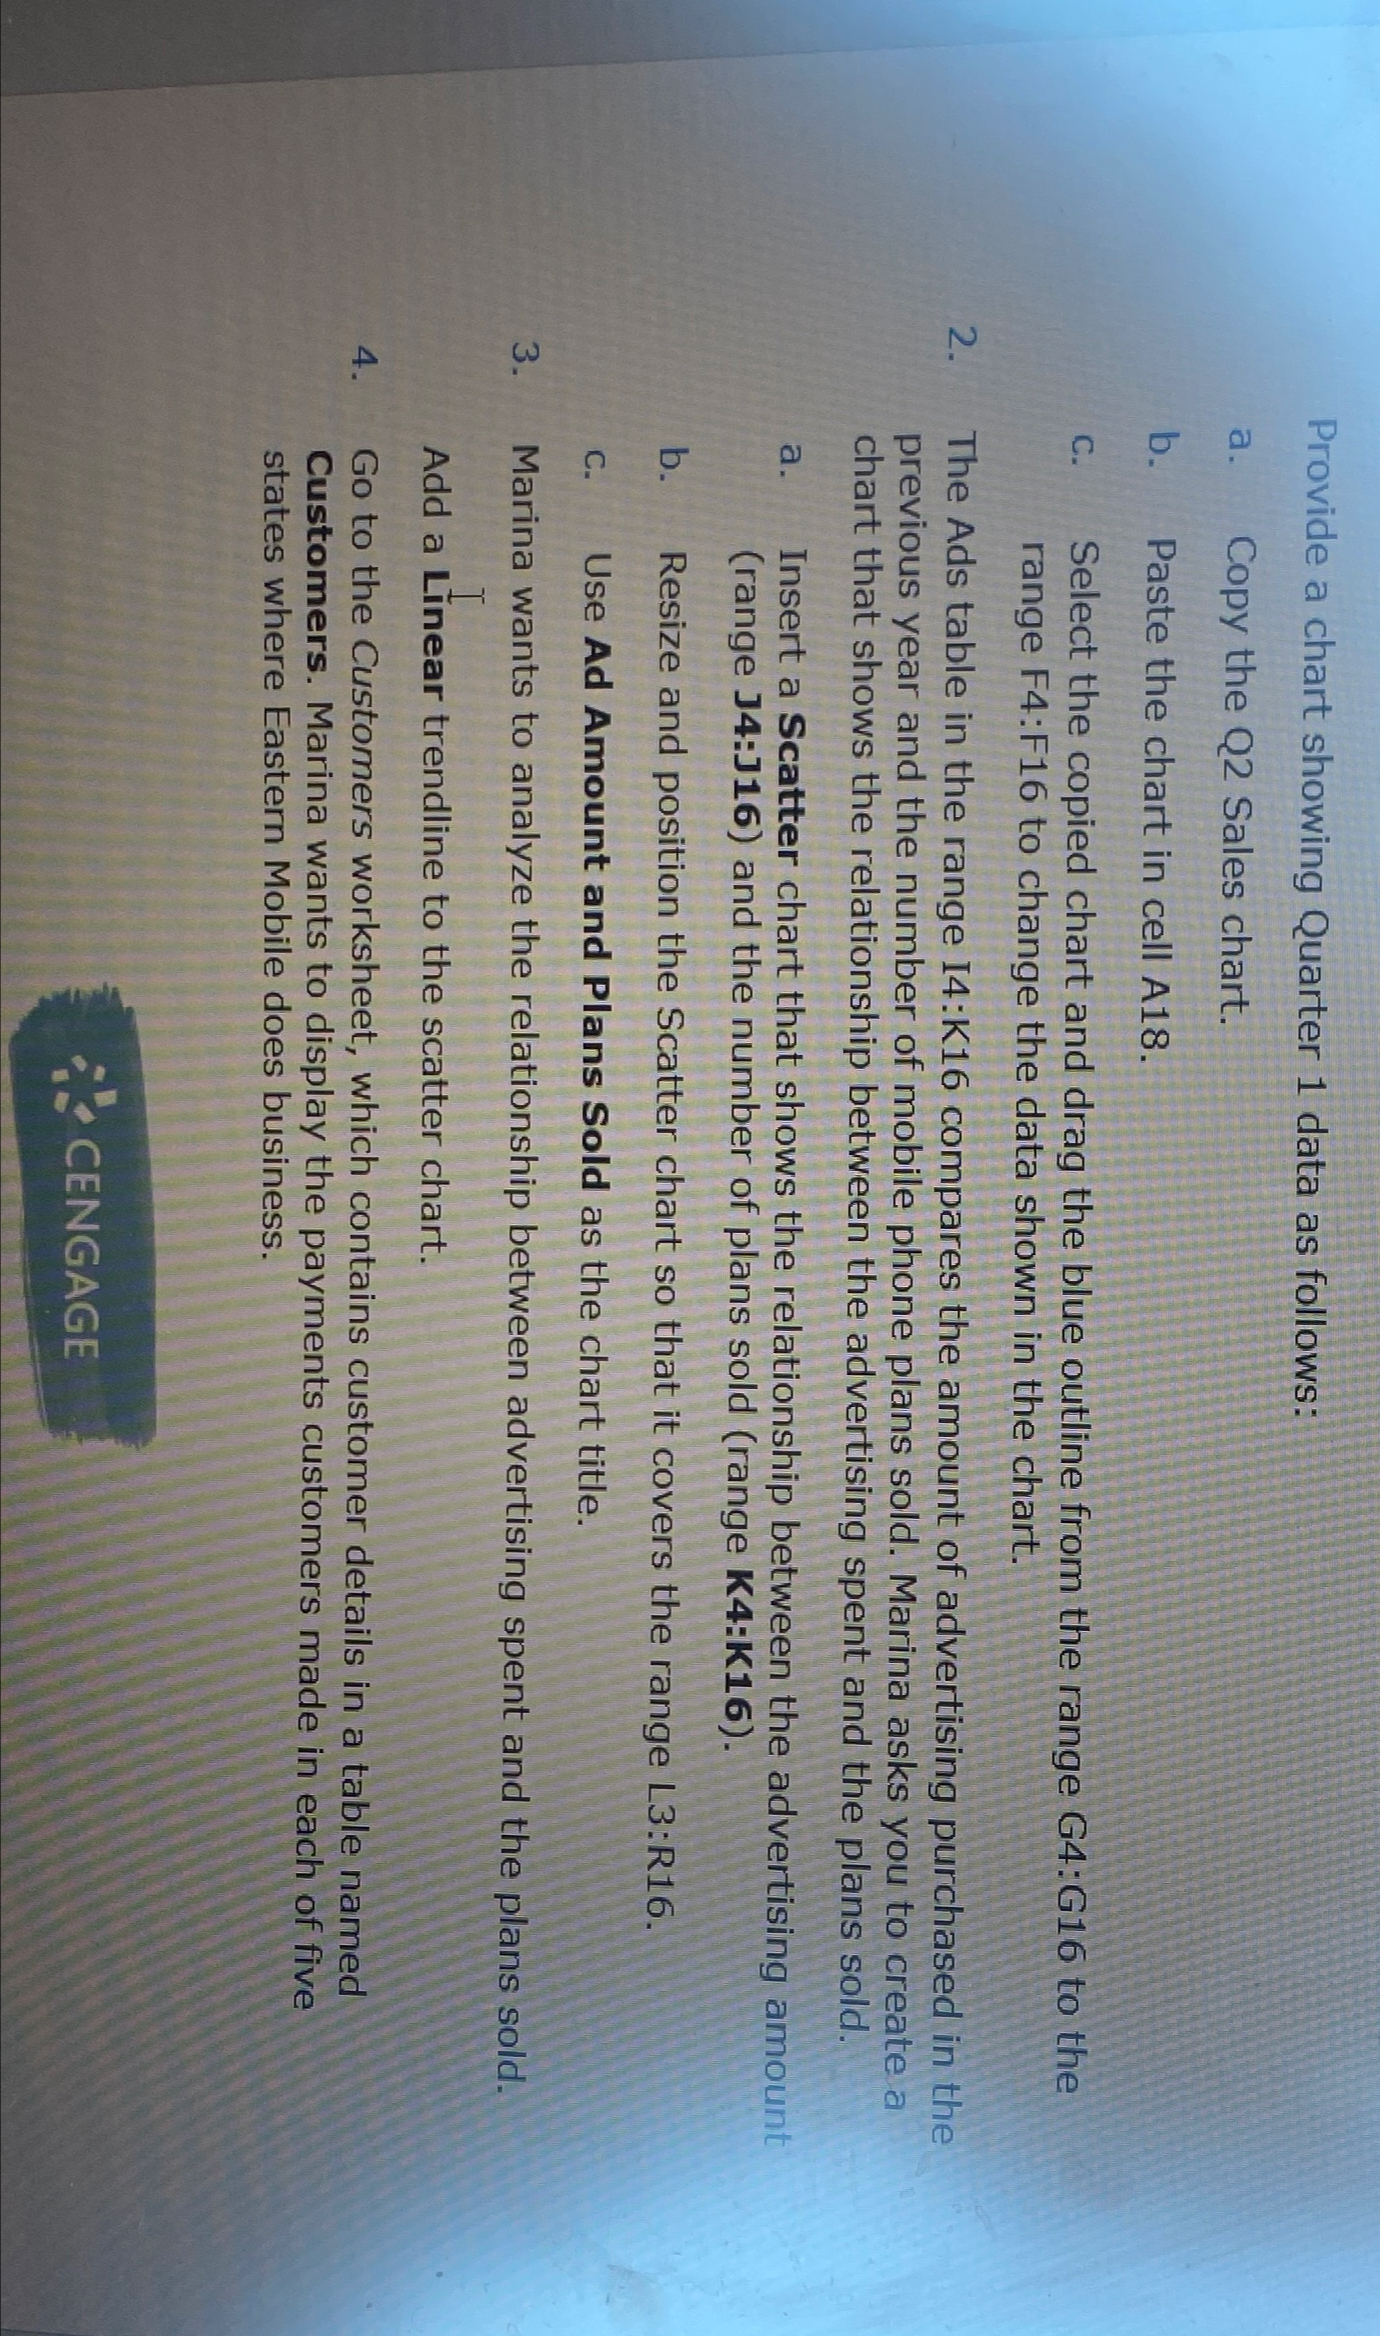
Provide a chart showing Quarter data as follows:
a Copy the Q Sales chart.
b Paste the chart in cell A
C Select the copied chart and drag the blue outline from the range G: G to the range : to change the data shown in the chart.
The Ads table in the range I:K compares the amount of advertising purchased in the previous year and the number of mobile phone plans sold. Marina asks you to create a chart that shows the relationship between the advertising spent and the plans sold.
a Insert a Scatter chart that shows the relationship between the advertising amount range J:J and the number of plans sold range K:K
b Resize and position the Scatter chart so that it covers the range L:R
c Use Ad Amount and Plans Sold as the chart title.
Marina wants to analyze the relationship between advertising spent and the plans sold. Add a Linear trendline to the scatter chart.
Go to the Customers worksheet, which contains customer details in a table named Customers. Marina wants to display the payments customers made in each of five states where Eastern Mobile does business.
Step by Step Solution
There are 3 Steps involved in it
1 Expert Approved Answer
Step: 1 Unlock

Question Has Been Solved by an Expert!
Get step-by-step solutions from verified subject matter experts
Step: 2 Unlock
Step: 3 Unlock