

Question: Provide a declining margin version of the NPV analysis, using the Exhibit 7 values and forecasting cash-flows thru 2023, include the terminal value in
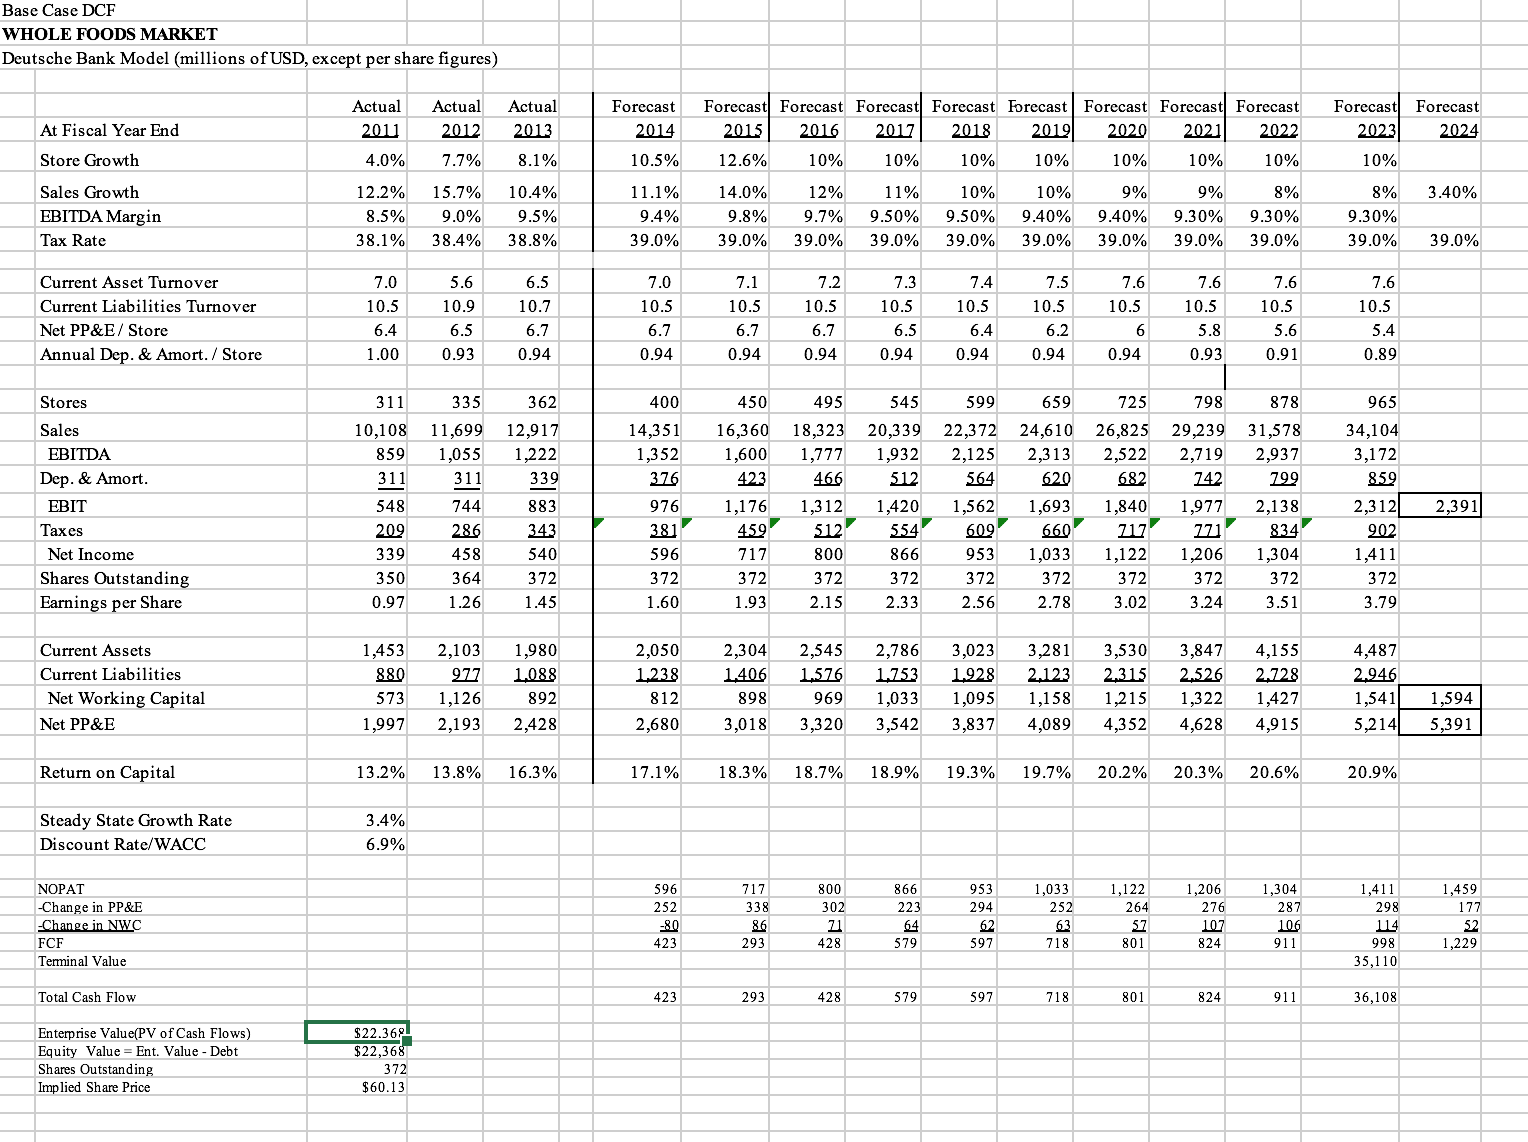
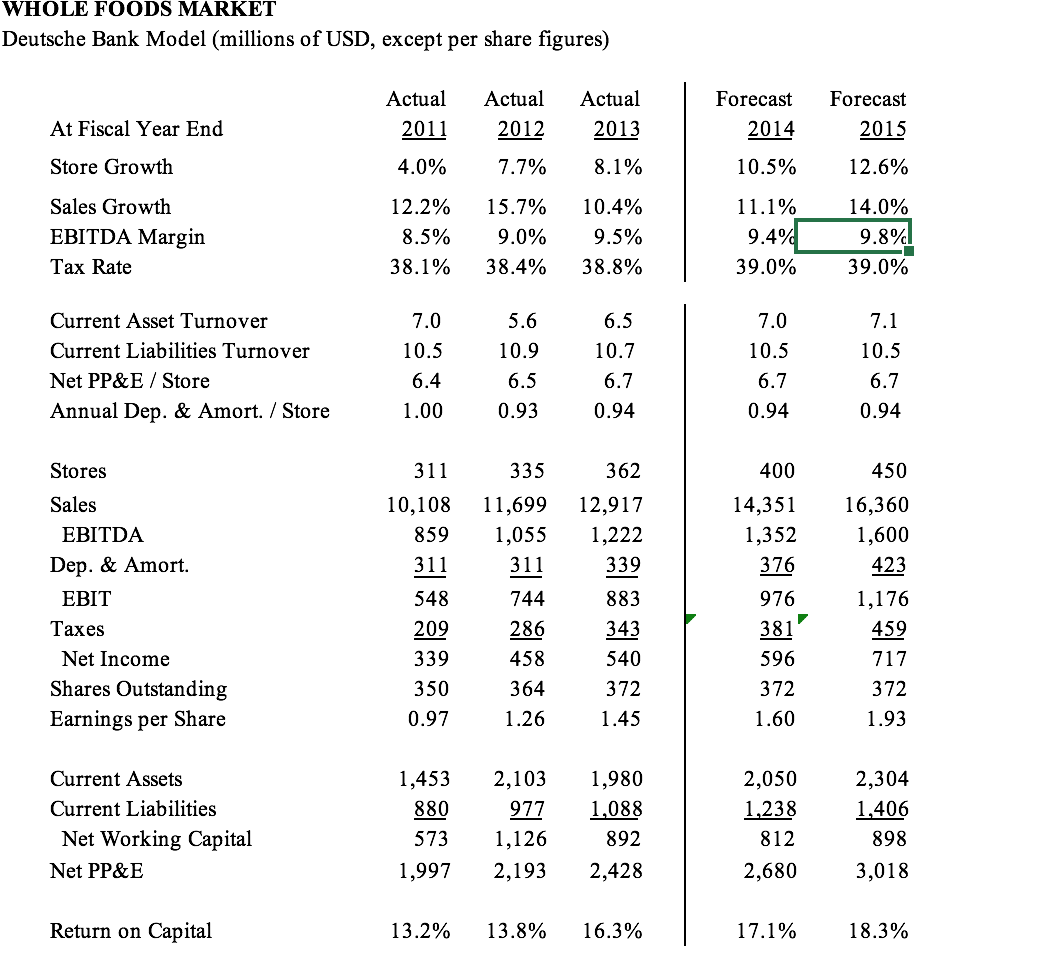
Provide a declining margin version of the NPV analysis, using the Exhibit 7 values and forecasting cash-flows thru 2023, include the terminal value in 2023. Comment on your results. The EBITDA margin declines by 0.5% each year. In the terminal year, the EBITDA margin is estimated at 4.9%, a level that is consistent with the EBITDA margins of conventional grocers. For the steady state growth rate use 3.4%, the real growth rate of 2% plus a rate of expected long-term inflation of 1.4% based on the prevailing 30-year government bond yield. Base Case DCF WHOLE FOODS MARKET Deutsche Bank Model (millions of USD, except per share figures) Actual Actual Actual At Fiscal Year End 2011 2012 2013 Forecast 2014 2015 2016 2017 2018 Store Growth Sales Growth 4.0% 7.7% 8.1% 10.5% 12.6% 10% 10% Forecast Forecast Forecast Forecast Forecast Forecast Forecast Forecast 2020 2021 2022 10% 10% Forecast Forecast 2019 10% 10% 2023 2024 10% 10% 12.2% 15.7% 10.4% 11.1% 14.0% 12% 11% EBITDA Margin Tax Rate 8.5% 9.0% 9.5% 38.1% 38.4% 38.8% 9.4% 9.8% 39.0% 9.7% 39.0% 39.0% 10% 9.50% 9.50% 9.40% 39.0% 39.0% 39.0% 10% 9% 9% 8% 8% 3.40% 9.40% 9.30% 9.30% 9.30% 39.0% 39.0% 39.0% 39.0% 39.0% Current Asset Turnover 7.0 5.6 6.5 7.0 7.1 7.2 7.3 7.4 7.5 7.6 7.6 7.6 7.6 Current Liabilities Turnover 10.5 10.9 10.7 10.5 10.5 10.5 10.5 10.5 10.5 10.5 10.5 10.5 10.5 Net PP&E/Store 6.4 6.5 6.7 6.7 6.7 6.7 6.5 6.4 6.2 6 5.8 5.6 5.4 Annual Dep. & Amort./Store 1.00 0.93 0.94 0.94 0.94 0.94 0.94 0.94 0.94 0.94 0.93 0.91 0.89 Stores 311 335 362 400 450 Sales 10,108 11,699 12,917 14,351 EBITDA 859 1,055 1,222 1,352 Dep. & Amort. 311 311 339 376 423 495 16,360 18,323 20,339 1,600 1,777 1,932 466 512 545 659 EBIT 548 744 883 976 1,176 1,312 1,420 1,562 599 22,372 24,610 26,825 29,239 31,578 2,125 2,313 2,522 2,719 2,937 564 620 682 742 1,693 1,840 725 798 878 965 34,104 3,172 799 859 1,977 2,138 2,312 2,391 Taxes 209 286 343 381 459 512 554 609 660 717 771 834 902 Net Income 339 458 540 596 717 800 866 953 1,033 1,122 1,206 1,304 1,411 Shares Outstanding 350 364 372 372 372 372 372 372 372 372 372 372 372 Earnings per Share 0.97 1.26 1.45 1.60 1.93 2.15 2.33 2.56 2.78 3.02 3.24 3.51 3.79 Current Assets 1,453 2,103 1,980 2,050 Current Liabilities Net Working Capital Net PP&E 1,997 880 573 1,126 2,193 2,428 977 1.088 892 1.238 812 2,680 2,304 2,545 2,786 1.406 1,576 1,753 898 969 1,033 3,018 3,320 3,542 3,023 3,281 3,530 3,847 4,155 1,928 2.123 2,315 2,526 2.728 1,095 1,158 1,215 1,322 1,427 3,837 4,089 4,352 4,628 4,915 4,487 2,946 1,541 1,594 5,214 5,391 Return on Capital 13.2% 13.8% 16.3% 17.1% 18.3% 18.7% 18.9% 19.3% 19.7% 20.2% 20.3% 20.6% 20.9% Steady State Growth Rate 3.4% Discount Rate/WACC 6.9% NOPAT -Change in PP&E -Change in NWC FCF Terminal Value Total Cash Flow 596 717 800 866 953 1,033 1,122 1,206 1,304 1,411 252 338 302 223 294 252 264 276 287 298 1,459 177 -80 86 71 64 62 63 57 107 106 114 52 423 293 428 579 597 718 801 824 911 998 1,229 35,110 423 293 428 579 597 718 801 824 911 36,108 Enterprise Value(PV of Cash Flows) $22.368 Equity Value Ent. Value - Debt $22,368 Shares Outstanding 372 Implied Share Price $60.13 WHOLE FOODS MARKET Deutsche Bank Model (millions of USD, except per share figures) Actual Actual Actual Forecast Forecast At Fiscal Year End Store Growth 2011 2012 2013 2014 2015 4.0% 7.7% 8.1% 10.5% 12.6% Sales Growth EBITDA Margin Tax Rate 12.2% 15.7% 10.4% 11.1% 14.0% 8.5% 9.0% 9.5% 9.4% 9.8% 38.1% 38.4% 38.8% 39.0% 39.0% Current Asset Turnover 7.0 5.6 6.5 7.0 7.1 Current Liabilities Turnover 10.5 10.9 10.7 10.5 10.5 Net PP&E / Store 6.4 6.5 6.7 6.7 6.7 Annual Dep. & Amort. / Store 1.00 0.93 0.94 0.94 0.94 Stores 311 335 362 400 450 Sales 10,108 11,699 12,917 14,351 16,360 EBITDA 859 1,055 1,222 1,352 1,600 Dep. & Amort. 311 311 339 376 423 EBIT 548 744 883 976 1,176 Taxes 209 286 343 381 459 Net Income 339 458 540 596 717 Shares Outstanding 350 364 372 372 372 Earnings per Share 0.97 1.26 1.45 1.60 1.93 Current Assets 1,453 2,103 1,980 2,050 2,304 Current Liabilities 880 977 1,088 1,238 1,406 Net Working Capital 573 1,126 892 812 898 Net PP&E 1,997 2,193 2,428 2,680 3,018 Return on Capital 13.2% 13.8% 16.3% 17.1% 18.3%
Step by Step Solution
There are 3 Steps involved in it

Get step-by-step solutions from verified subject matter experts