Provide a Market Share Ratio Analysis based on Dividends paid to net assets, PER and PBR through
Fantastic news! We've Found the answer you've been seeking!
Question:
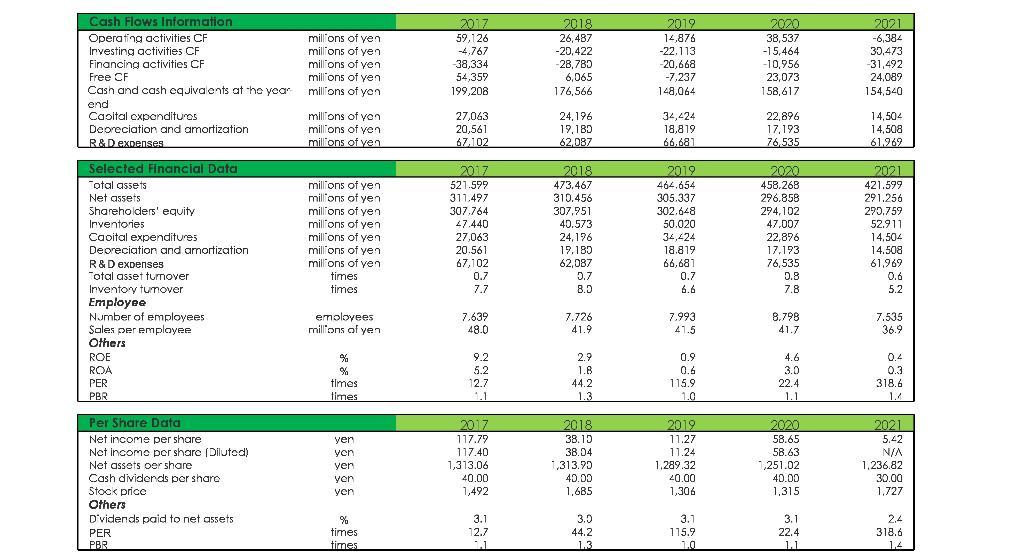
Provide a Market Share Ratio Analysis based on Dividends paid to net assets, PER and PBR through following tables:
Transcribed Image Text:
Cash Flows Information Operating activities CF Investing activities CF millions of yen Financing activities CF Free CF millions of yen Cash and cash equivalents at the year millions of yon end Capital expenditures Depreciation and amortization R&D expenses. Selected Financial Data Total assets Net assets Shareholders' equity Inventories Capital expenditures Depreciation and amortization R & D expenses Total asset turnover Inventory tumover. Employee Number of employees Sales per employee Others ROE ROA PER PBR Per Share Data Net income per share Not income per share (Diluted) Net assets oer share Cash dividends per share Stock price Others D'vidends paid to net assets millions of ven millions of yen PER PBR millions of yon millions of yen millions of yen millions of yen millions of yen millions of yen millions of yen millions of yen millions of yen millions of yen times times employees millions of yen % % times times yer yon yen yen yen % times times 2017 59,126 -4,767 -38,334 54,359 199,208 27,063 20,561 67,102 2017 521.599 311,497 307,764 47.440 27,063 20.561 67,102 0.7 7.7 7.639 48.0 9.2 5.2 12.7 2017 117.79 117.40 1,313.06 40.00 1,492 3.1 12.7 1.1 2018 26,487 -20,422 -28,780 6,065 176,566 24,196 19,180 62,087 2018 473,467 310.456 307,951 40.573 24,196 19,180 62,087 0.7 8.0 7.726 41.9 2.9 1.8 44.2 1.3 2018 38.10 38.04 1,313.90 40.00 1,685 3.0 44.2 1.3 2019 14,876 -22.113 -20,668 -7,237 148,064 34,424 18,819 66.681 2019 464.654 305.337 302.648 50.020 34,424 18.819 66,681 0.7 6.6 7.993 41.5 0.9 0.6 115.9 1.0 2019 11.27 11.24 1,289.32 40.00 1,306 3.1 115.9 1.0 2000 38,537 -15,464 -10,956 23,073 158,617 22,896 17,193 76,535 2020 458.268 296.858 294,102 47.007 22,876 17.193 76,535 0.8 7.8 8.798 41.7 4.6 3.0 22.4 1.1 2020 58.65 58.63 1,251.02 40.00 1,315 3.1 22.4 1.1 2021 -6,384 30,473 -31,492 24,089 154,540 14,504 14,508 61,969 2021 421.599 291,256 290.759 52.911 14,504 14.508 61,969 0.6 5.2 7.535 36.9 0.4 0.3 318.6 2021 5.42 N/A 1,236.82 30.00 1,727 2.4 318.6 1,4 Cash Flows Information Operating activities CF Investing activities CF millions of yen Financing activities CF Free CF millions of yen Cash and cash equivalents at the year millions of yon end Capital expenditures Depreciation and amortization R&D expenses. Selected Financial Data Total assets Net assets Shareholders' equity Inventories Capital expenditures Depreciation and amortization R & D expenses Total asset turnover Inventory tumover. Employee Number of employees Sales per employee Others ROE ROA PER PBR Per Share Data Net income per share Not income per share (Diluted) Net assets oer share Cash dividends per share Stock price Others D'vidends paid to net assets millions of ven millions of yen PER PBR millions of yon millions of yen millions of yen millions of yen millions of yen millions of yen millions of yen millions of yen millions of yen millions of yen times times employees millions of yen % % times times yer yon yen yen yen % times times 2017 59,126 -4,767 -38,334 54,359 199,208 27,063 20,561 67,102 2017 521.599 311,497 307,764 47.440 27,063 20.561 67,102 0.7 7.7 7.639 48.0 9.2 5.2 12.7 2017 117.79 117.40 1,313.06 40.00 1,492 3.1 12.7 1.1 2018 26,487 -20,422 -28,780 6,065 176,566 24,196 19,180 62,087 2018 473,467 310.456 307,951 40.573 24,196 19,180 62,087 0.7 8.0 7.726 41.9 2.9 1.8 44.2 1.3 2018 38.10 38.04 1,313.90 40.00 1,685 3.0 44.2 1.3 2019 14,876 -22.113 -20,668 -7,237 148,064 34,424 18,819 66.681 2019 464.654 305.337 302.648 50.020 34,424 18.819 66,681 0.7 6.6 7.993 41.5 0.9 0.6 115.9 1.0 2019 11.27 11.24 1,289.32 40.00 1,306 3.1 115.9 1.0 2000 38,537 -15,464 -10,956 23,073 158,617 22,896 17,193 76,535 2020 458.268 296.858 294,102 47.007 22,876 17.193 76,535 0.8 7.8 8.798 41.7 4.6 3.0 22.4 1.1 2020 58.65 58.63 1,251.02 40.00 1,315 3.1 22.4 1.1 2021 -6,384 30,473 -31,492 24,089 154,540 14,504 14,508 61,969 2021 421.599 291,256 290.759 52.911 14,504 14.508 61,969 0.6 5.2 7.535 36.9 0.4 0.3 318.6 2021 5.42 N/A 1,236.82 30.00 1,727 2.4 318.6 1,4
Expert Answer:
Answer rating: 100% (QA)
1 Dividends paid to net assets 2017 59126 148064 04 2018 26487 148064 018 20... View the full answer
Related Book For
Financial Accounting
ISBN: 978-0077862268
2nd edition
Authors: J. David Spiceland, Wayne Thomas, Don Herrmann
Posted Date:
Students also viewed these accounting questions
-
1. Provide a Liquidity Ratio Analysis based on the current ratio. 2. Provide a Profitability Ratio Analysis based on the ROA, ROE, Overseas Sales Ratio, Cost of Sales to Net Sales and Gross Profit to...
-
Based on the data in the DDB Tables 1B through 7B, what characterizes individuals who believe that individuality is an important value to pass on to kids?
-
Based on DDB Tables 1B through 7B, what characterizes individuals who feel TV commercials place too much emphasis on sex? What are the marketing and regulatory implications of this?
-
Elastic bands are attached to tuning fork 1 ( which was 2 5 6 Hz ) to reduce its frequency. It is sounded again with tuning fork 2 ( 2 5 5 Hz ) , making 1 2 beats in 6 . 0 s . What is the new...
-
The Associated Press Team Marketing Report listed the Dallas Cowboys as the team with the highest ticket prices in the National Football League (USA Today, October 20, 2009). Data showing the average...
-
Calculate the number of carbon atoms in 1.00 g of blood sugar, C 6 H 12 O 6 .
-
What are the limitations of gas turbines ?
-
South Seas Products, Inc., has designed a new surfboard to replace its old surfboard line. Because of the unique design of the new surfboard, the company anticipates that it will be able to sell all...
-
Use the Chain Rule to find the indicated partial derivatives. z=3x-5y; x = u46v, y = (2u - v); dz dz au av 20 220 = = 12u3-56 (2u-v)3 -24(v-2u)3-48v2 eBook Submit Answer x
-
Given this, answer the following questions: 1. Draw a diagram of the process using the format in Exhibit 7.3. 2. Consider a base case where a customer arrives every 40 seconds and the Customer...
-
If the balances in both accounts receivable and accounts payable decrease by the same amount during the year: the decrease in both the accounts receivable and accounts payable balances will result in...
-
What are some of the stereotypes of family, marriage, and gender practices in the Middle Eastern Islamic countries?
-
What is applied anthropology? Erve Chambers suggests that there are different roles that applied anthropologists play. Discuss each of these roles as it applies to present-day applied anthropological...
-
What is science, and how does differ from religion?
-
Explain the role and functions of the Option Clearing Corporation.
-
Discuss some of the problems of ethnicity in the Middle East and Asia that have been influenced by globalization.
-
A two-ply laminate composite has the top and bottom ply orientations of 45 and 0 and thicknesses of 2 and 4 mm, respectively. The stiffness matrix for the 0 ply is [Qij] - 20 1 0 3 0 0 1 0 GPa. Find...
-
Pearl Medavoy will invest $10,240 a year for 20 years in a fund that will earn 10% annual interest. . If the first payment into the fund occurs today, what amount will be in the fund in 20 years? If...
-
The balance sheet for Virtual Gaming Systems for 2012 and 2011 is provided below. Required: 1. Prepare a vertical analysis of Virtual Gaming Systems' 2012 and 2011 balance sheets. Express each amount...
-
At the end of the year, Dahir Incorporated's balance of Allowance for Uncollectible Accounts is $2,000 (credit) before adjustment. The company estimates future uncollectible accounts to be $10,000....
-
Game-On Sports operates in two distinct segments: athletic equipment and accessories. The income statement for each operating segment is presented below. Required: 1. Complete the "%" columns to be...
-
If rp is positive in Equation 14.9, then foreign assets are perceived as being more risky than domestic counterparts. In that case, according to Equation 14.9, what will happen to the exchange rate...
-
Consider the monetary approach to exchange rates (MAER) model given in Equation 15.19. Suppose that each of the domestic hat variables in that equation is growing at exactly the same rate as its...
-
Philip and Lance have decided to form a partnership by investing \($100000\) and \($80000\) respectively. The following plans for dividing profits and losses are under consideration. Sharing profits...
Study smarter with the SolutionInn App