

Question: Provide an appropriate response. 45) The data below represent the numbers of absences and the final grades of 15 randomly selected students from an astronomy
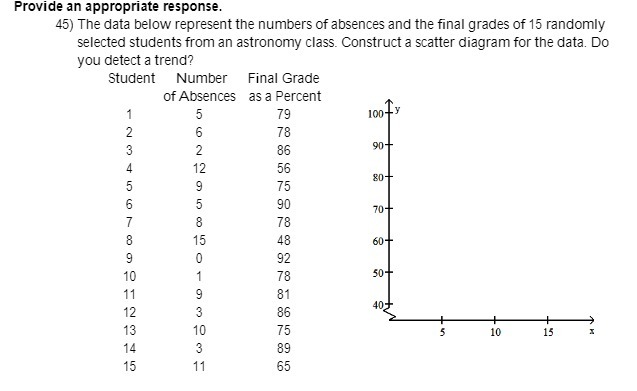
Provide an appropriate response. 45) The data below represent the numbers of absences and the final grades of 15 randomly selected students from an astronomy class. Construct a scatter diagram for the data. Do you detect a trend? Student Number Final Grade of Absences as a Percent 79 100 Ly 78 86 90- 56 75 80- 90 70- 78 48 60 92 78 50+ 81 86 402 13 75 10 14 15 89 15 11 65
Step by Step Solution
There are 3 Steps involved in it
1 Expert Approved Answer
Step: 1 Unlock

Question Has Been Solved by an Expert!
Get step-by-step solutions from verified subject matter experts
Step: 2 Unlock
Step: 3 Unlock