

Question: Provide the correct answer only. No explanation required. How is the plot shown in the figure below called? Escherichwa con 1.0 0.8 0.6 Sensitivity 0.4
Provide the correct answer only. No explanation required.
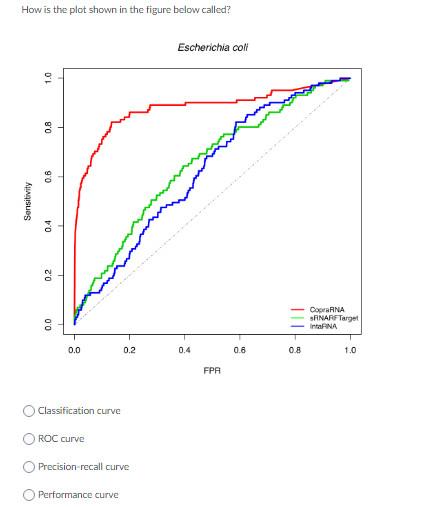
How is the plot shown in the figure below called? Escherichwa con 1.0 0.8 0.6 Sensitivity 0.4 0.2 Copra NA NARF Target IRNA 0.0 0.0 0.2 0.4 0.6 0.8 1.0 FPA Classification curve ROC curve Precision-recall curve Performance curve
Step by Step Solution
There are 3 Steps involved in it
1 Expert Approved Answer
Step: 1 Unlock

Question Has Been Solved by an Expert!
Get step-by-step solutions from verified subject matter experts
Step: 2 Unlock
Step: 3 Unlock