

Question: provide the details Conclusions 2. EXPERIMENTAL DESIGN In this section we explained the formula of WMAE presented in Kaggle competition and analysed the importance of
provide the details Conclusions
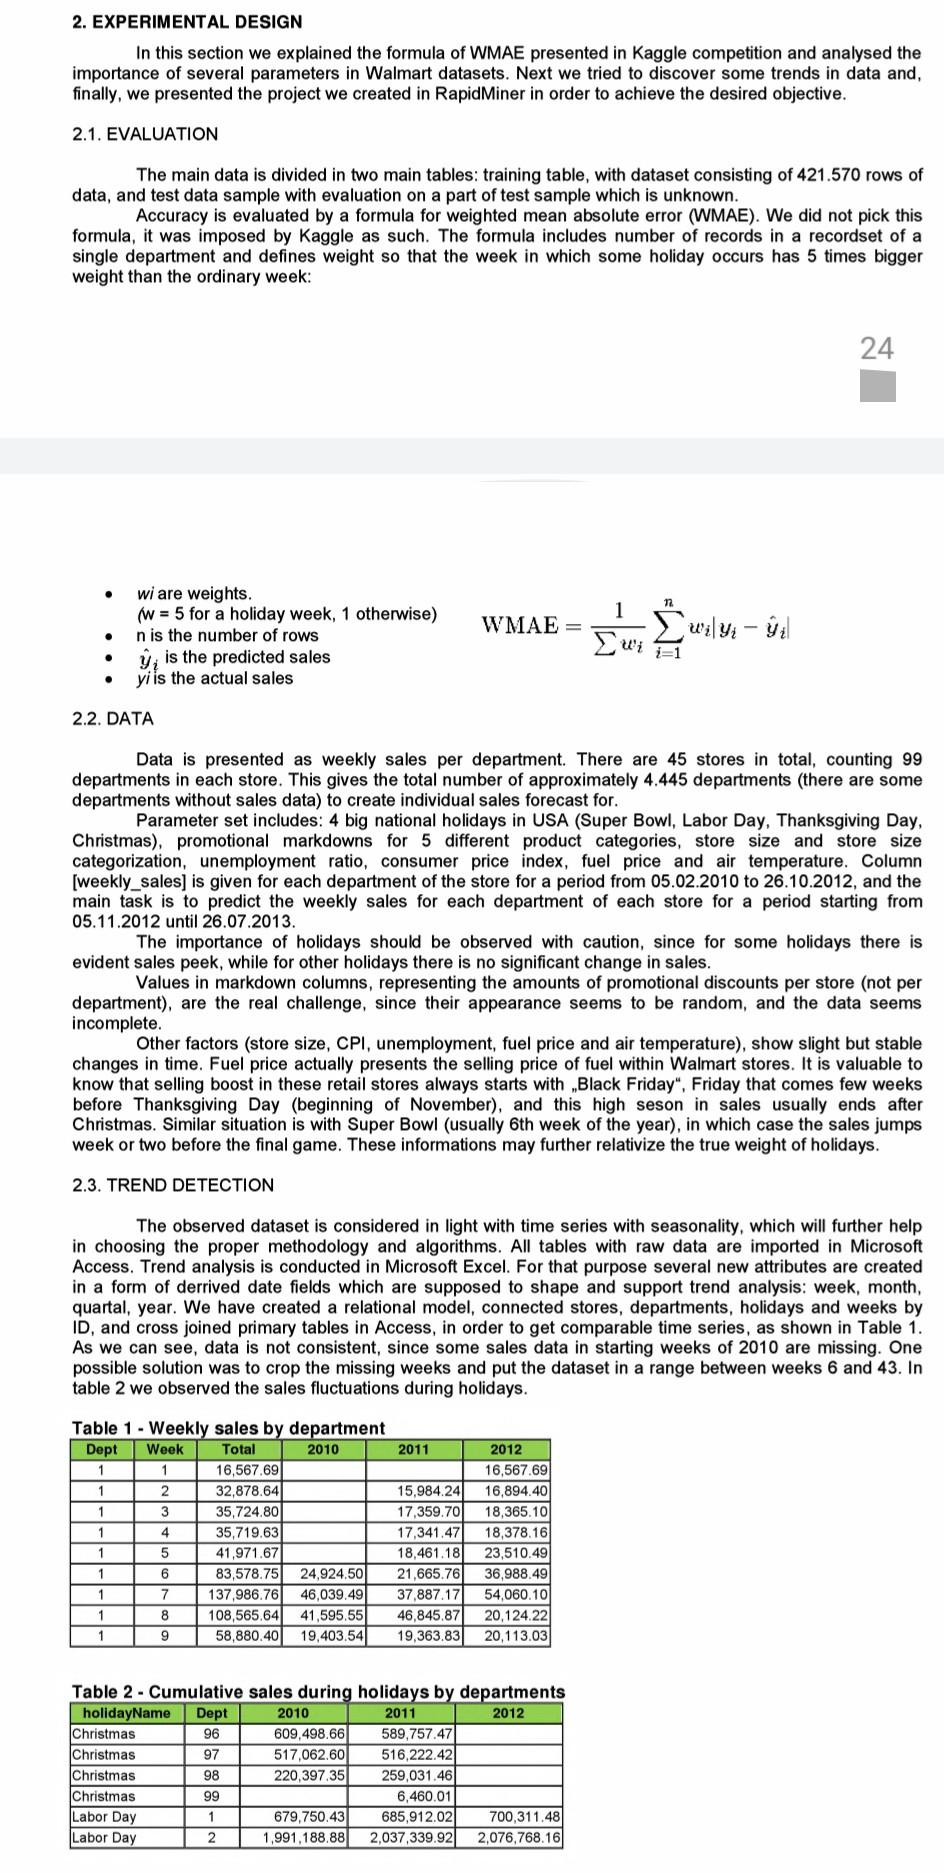
2. EXPERIMENTAL DESIGN In this section we explained the formula of WMAE presented in Kaggle competition and analysed the importance of several parameters in Walmart datasets. Next we tried to discover some trends in data and, finally, we presented the project we created in RapidMiner in order to achieve the desired objective. 2.1. EVALUATION The main data is divided in two main tables: training table, with dataset consisting of 421.570 rows of data, and test data sample with evaluation on a part of test sample which is unknown. Accuracy is evaluated by a formula for weighted mean absolute error (WMAE). We did not pick this formula, it was imposed by Kaggle as such. The formula includes number of records in a recordset of a single department and defines weight so that the week in which some holiday occurs has 5 times bigger weight than the ordinary week: 24 . n 1 WMAE wi are weights. (W = 5 for a holiday week, 1 otherwise) n is the number of rows is the predicted sales yi is the actual sales Iwi - . 2.2. DATA Data is presented as weekly sales per department. There are 45 stores in total, counting 99 departments in each store. This gives the total number of approximately 4.445 departments (there are some departments without sales data) to create individual sales forecast for. Parameter set includes: 4 big national holidays in USA (Super Bowl, Labor Day, Thanksgiving Day, Christmas), promotional markdowns for 5 different product categories, store size and store size categorization, unemployment ratio, consumer price index, fuel price and air temperature. Column [weekly_sales) is given for each department of the store for a period from 05.02.2010 to 26.10.2012, and the main task is to predict the weekly sales for each department of each store for a period starting from 05.11.2012 until 26.07.2013. The importance of holidays should be observed with caution, since for some holidays there is evident sales peek, while for other holidays there is no significant change in sales. Values in markdown columns, representing the amounts of promotional discounts per store (not per department), are the real challenge, since their appearance seems to be random, and the data seems incomplete. Other factors (store size, CPI, unemployment, fuel price and air temperature), show slight but stable changes in time. Fuel price actually presents the selling price of fuel within Walmart stores. It is valuable to know that selling boost in these retail stores always starts with Black Friday, Friday that comes few weeks before Thanksgiving Day (beginning of November), and this high seson in sales usually ends after Christmas. Similar situation is with Super Bowl (usually 6th week of the year), in which case the sales jumps week or two before the final game. These informations may further relativize the true weight of holidays. 2.3. TREND DETECTION The observed dataset is considered in light with time series with seasonality, which will further help in choosing the proper methodology and algorithms. All tables with raw data are imported in Microsoft Access. Trend analysis is conducted in Microsoft Excel. For that purpose several new attributes are created in a orm of derrived date fields which are supposed to shape support trend analysis: week, month, quartal, year. We have created a relational model, connected stores, departments, holidays and weeks by ID, and cross joined primary tables in Access, in order to get comparable time series, as shown in Table 1. As we can see, data is not consistent, since some sales data in starting weeks of 2010 are missing. One possible solution was to crop the missing weeks and put the dataset in a range between weeks 6 and 43. In table 2 we observed the sales fluctuations during holidays. Table 1 - Weekly sales by department Dept Week Total 2010 2011 1 1 16,567.69 1 2 32,878.64 15,984.24 1 3 35,724.80 17,359.70 1 4 35,719.63 17,341.47 1 5 41,971.67 18,461.18 1 6 83,578.75 24,924.50 21,665.76 1 7 137,986.76 46,039.49 37,887.17 1 8 108,565,64 41,595.55 46,845.87 1 9 58,880.40 19,403.54 19,363.83 2012 16,567.69 16,894.40 18,365.10 18,378.16 23,510.49 36,988.49 54,060.10 20,124.22 20.113.03 Table 2 - Cumulative sales during holidays by departments holidayName Dept 2010 2011 2012 Christmas 96 609,498.66 589,757.47 Christmas 97 517,062.60 516,222.42 Christmas 98 220,397.35 259,031.46 Christmas 99 6,460.01 Labor Day 1 679,750.43 685,912.02 700,311.48 Labor Day 2 1,991,188.88 2,037,339.92 2,076,768.16Step by Step Solution
There are 3 Steps involved in it
1 Expert Approved Answer
Step: 1 Unlock

Question Has Been Solved by an Expert!
Get step-by-step solutions from verified subject matter experts
Step: 2 Unlock
Step: 3 Unlock