

Question: Provide the experimental and the theoretical calculations for each case you did. Do an error analysis between the two (experimental and theoretical) in each case.

Provide the experimental and the theoretical calculations for each case you did.
Do an error analysis between the two (experimental and theoretical) in each case.
Provide the efficiency Vs degree of loading curve corresponding to the two power factors that you experimented at. Make sure the 2 graphs are on the same figure. And comment on the graph.
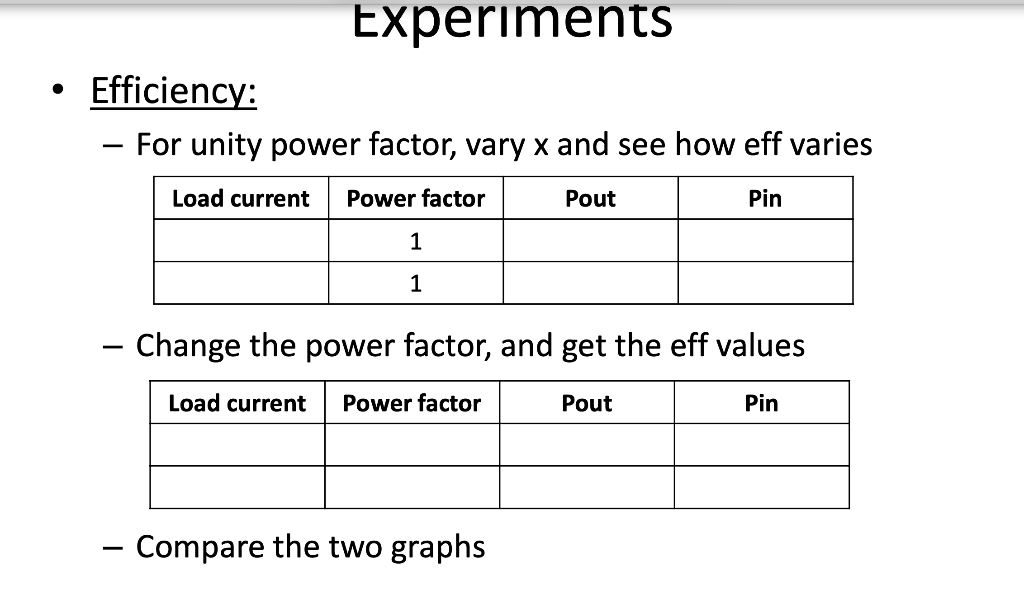
Experiments Efficiency: For unity power factor, vary x and see how eff varies Load current Power factor Pout Pin 1 1 - Change the power factor, and get the eff values Load current Power factor Pout Pin - Compare the two graphs Experiments Efficiency: For unity power factor, vary x and see how eff varies Load current Power factor Pout Pin 1 1 - Change the power factor, and get the eff values Load current Power factor Pout Pin - Compare the two graphs
Step by Step Solution
There are 3 Steps involved in it

Get step-by-step solutions from verified subject matter experts