

Question: Provide the matlab code of the following: ( 2 D Plots ) Let x be a row vector all integers from 1 to 1 0
Provide the matlab code of the following: D Plots Let be a row vector all integers from to The following functions of are
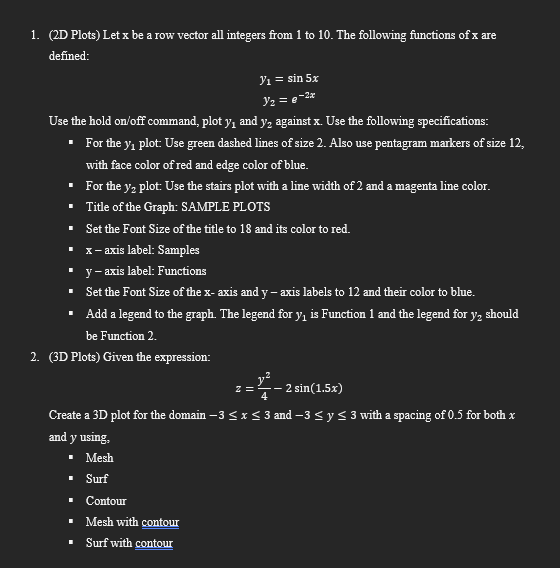
defined:
Use the hold onoff command, plot and against Use the following specifications:
For the plot Use green dashed lines of size Also use pentagram markers of size
with face color of red and edge color of blue.
For the plot: Use the stairs plot with a line width of and a magenta line color.
Title of the Graph: SAMPLE PLOTS
Set the Font Size of the title to and its color to red.
axis label: Samples
axis label: Functions
Set the Font Size of the axis and axis labels to and their color to blue.
Add a legend to the graph. The legend for is Function and the legend for should
be Function
D Plots Given the expression:
Create a D plot for the domain and with a spacing of for both
and using,
Mesh
Surf
Contour
Mesh with contour
Surf with contour
Step by Step Solution
There are 3 Steps involved in it
1 Expert Approved Answer
Step: 1 Unlock

Question Has Been Solved by an Expert!
Get step-by-step solutions from verified subject matter experts
Step: 2 Unlock
Step: 3 Unlock