

Question: Provided below are data collected by TifCo pertaining to direct labor hours and manufacturing overhead costs for the first 10 months of FY2021. Month Labor
Provided below are data collected by TifCo pertaining to direct labor hours and manufacturing overhead costs for the first 10 months of FY2021. Month Labor Hrs OH Costs $'s Jan 1,776 23,203 Feb 1,074 21,934 Mar 1,610 20,138 Apr 2,091 25,007 May 2,375 27,525 Jun 1,892 25,091 Jul 1,749 22,758 Aug 1,836 23,721 Sep 1,009 15,323 Oct 1,691 21,236A plot of the data in the table is shown next A regression of the cost model: OverHead = Fixed Costs + b * Labor Hrsusing this data produced the following results: Estimate Std. Error t-Stat P-Valueintercept 10853.4 2554.83 4.248 0.003labor hrs 6.86 1.455 4.715 0.002 A concern was raised about the value assigned to the February overhead costs. It seems that an accounting error may have overstated these costs by $7,000. A correction was made in the accounting system, but was not reflected in the data. After the data was adjusted another regression was run and produced the following results: Estimate Std. Error t-Stat P-Value intercept 5233.9 1182.75 4.425 0.002labor hrs 9.74 0.674 14.35 0.000 Choose the most appropriate model and estimate the expected overhead costs for November assuming an expected usage of 2340 direct labor hours. Tifco's average wage rate is $29.52 per labor hour. Round your solution to the nearest $1.00.
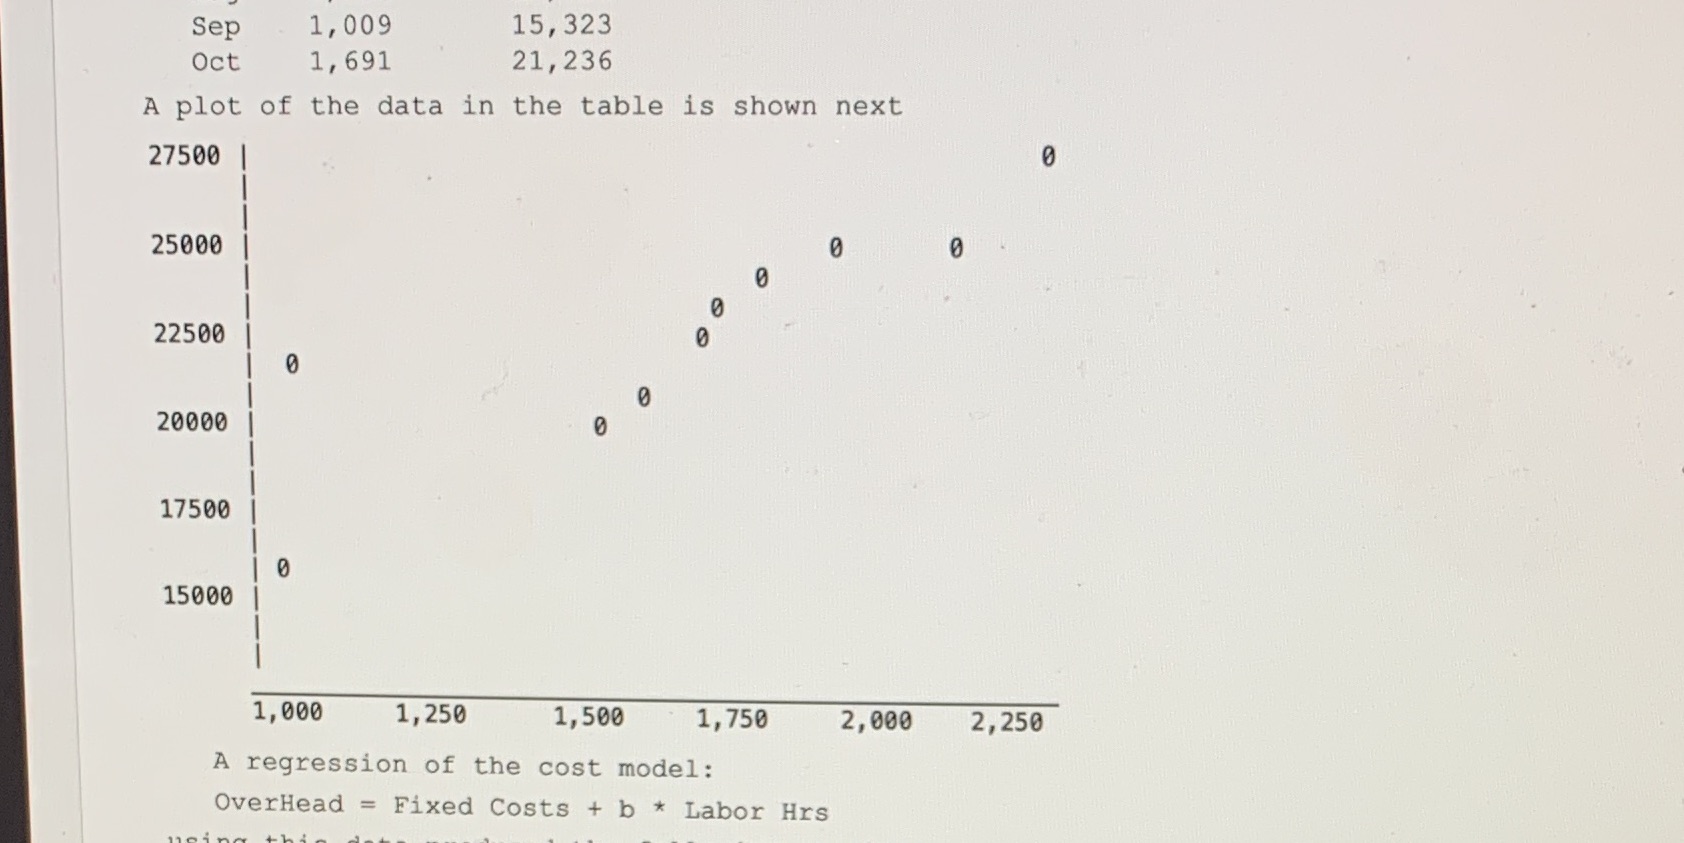
Sep 1, 009 15, 323 Oct 1, 691 21, 236 A plot of the data in the table is shown next 27500 0 25000 0 22500 0 20000 17500 15000 1, 000 1, 250 1, 500 1, 750 2, 000 2, 250 A regression of the cost model: OverHead = Fixed Costs + b * Labor Hrs
Step by Step Solution
There are 3 Steps involved in it

Get step-by-step solutions from verified subject matter experts