

Question: Provided in the excel file are two data sets with rate data for US treasury yields from two different years. Construct a yield curve for
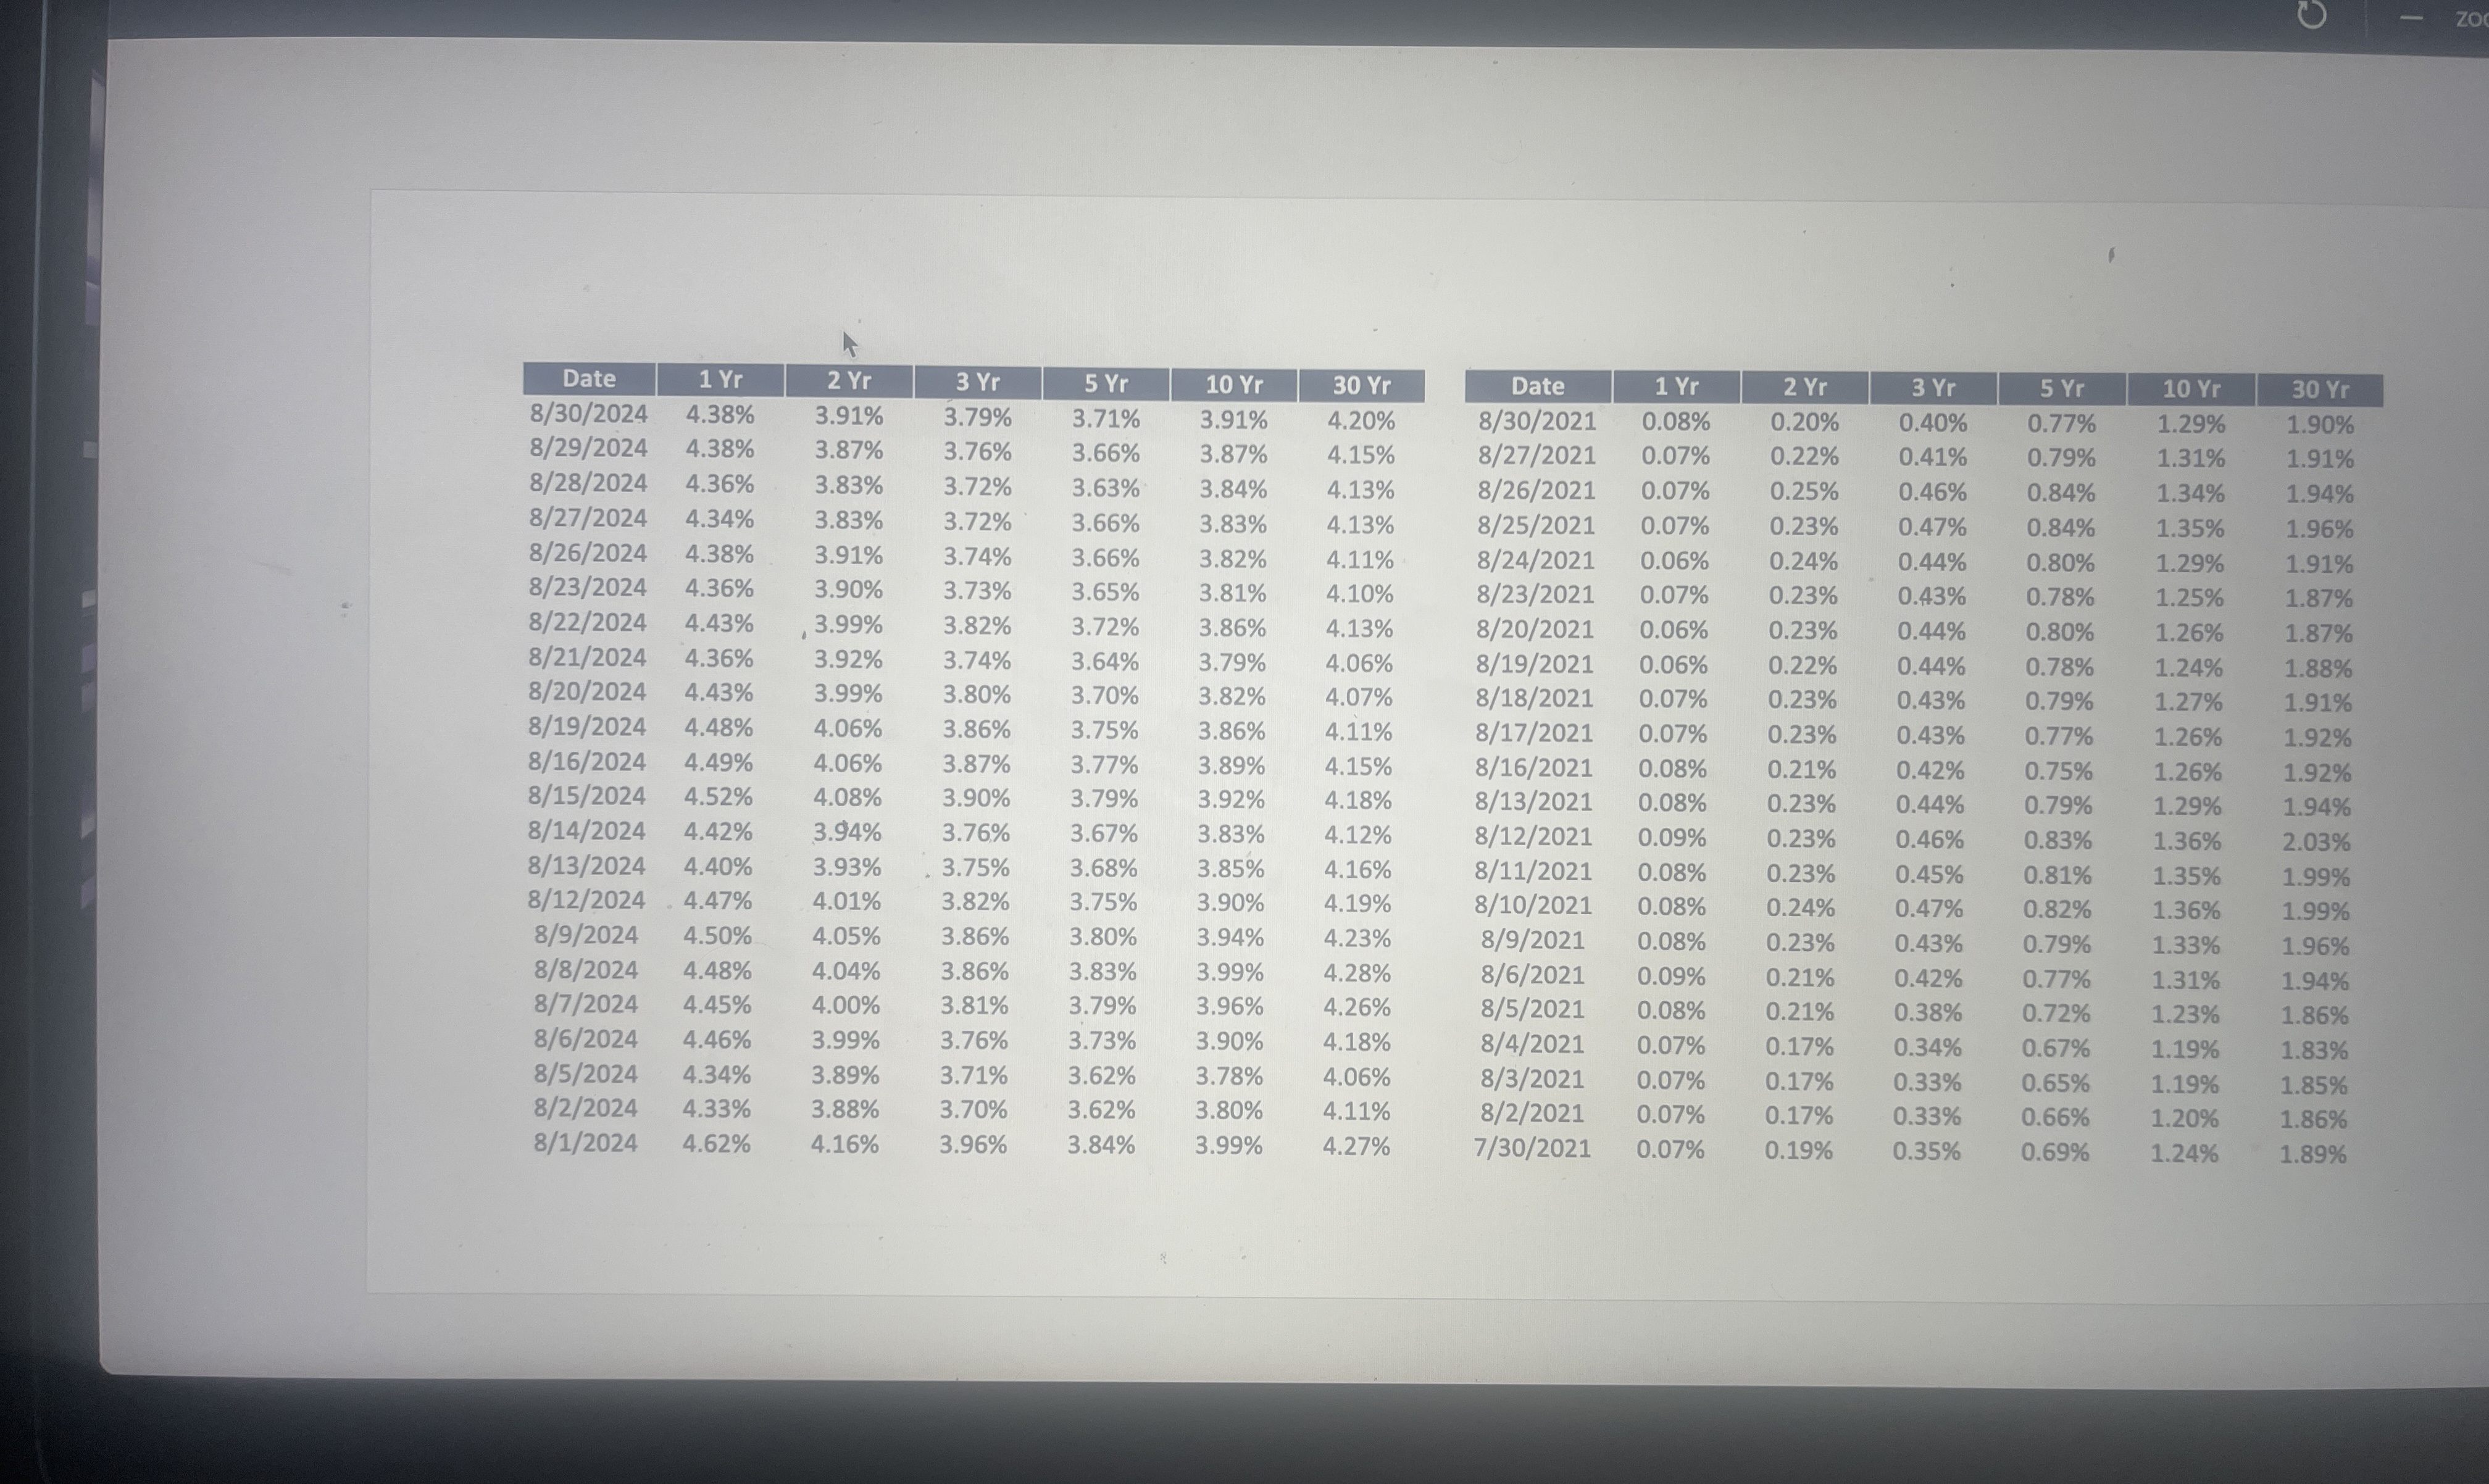
Provided in the excel file are two data sets with rate data for US treasury yields from two different years.
Construct a yield curve for each data set, utilizing the rates from for data set and for
data set
Calculate the spread for all dates in data set and
Define which of the data sets has an inverted yield curve and interpret the inversion.
a What is an inverted yield curve and what does it represent?
b Is there a better predictor of a recession than the year spread?
c Define a recession.
Please submit your excel file with graphs and calculations as well as a pdf writeup that show your answers for each question.
Step by Step Solution
There are 3 Steps involved in it
1 Expert Approved Answer
Step: 1 Unlock

Question Has Been Solved by an Expert!
Get step-by-step solutions from verified subject matter experts
Step: 2 Unlock
Step: 3 Unlock