

Question: pt Here is a bivariate data set. X y 73.3 113.9 82.3 65.7 87.6 43 69.1 108 63.7 98.6 77.8 109.6 70.8 144.7 49.4 152.4
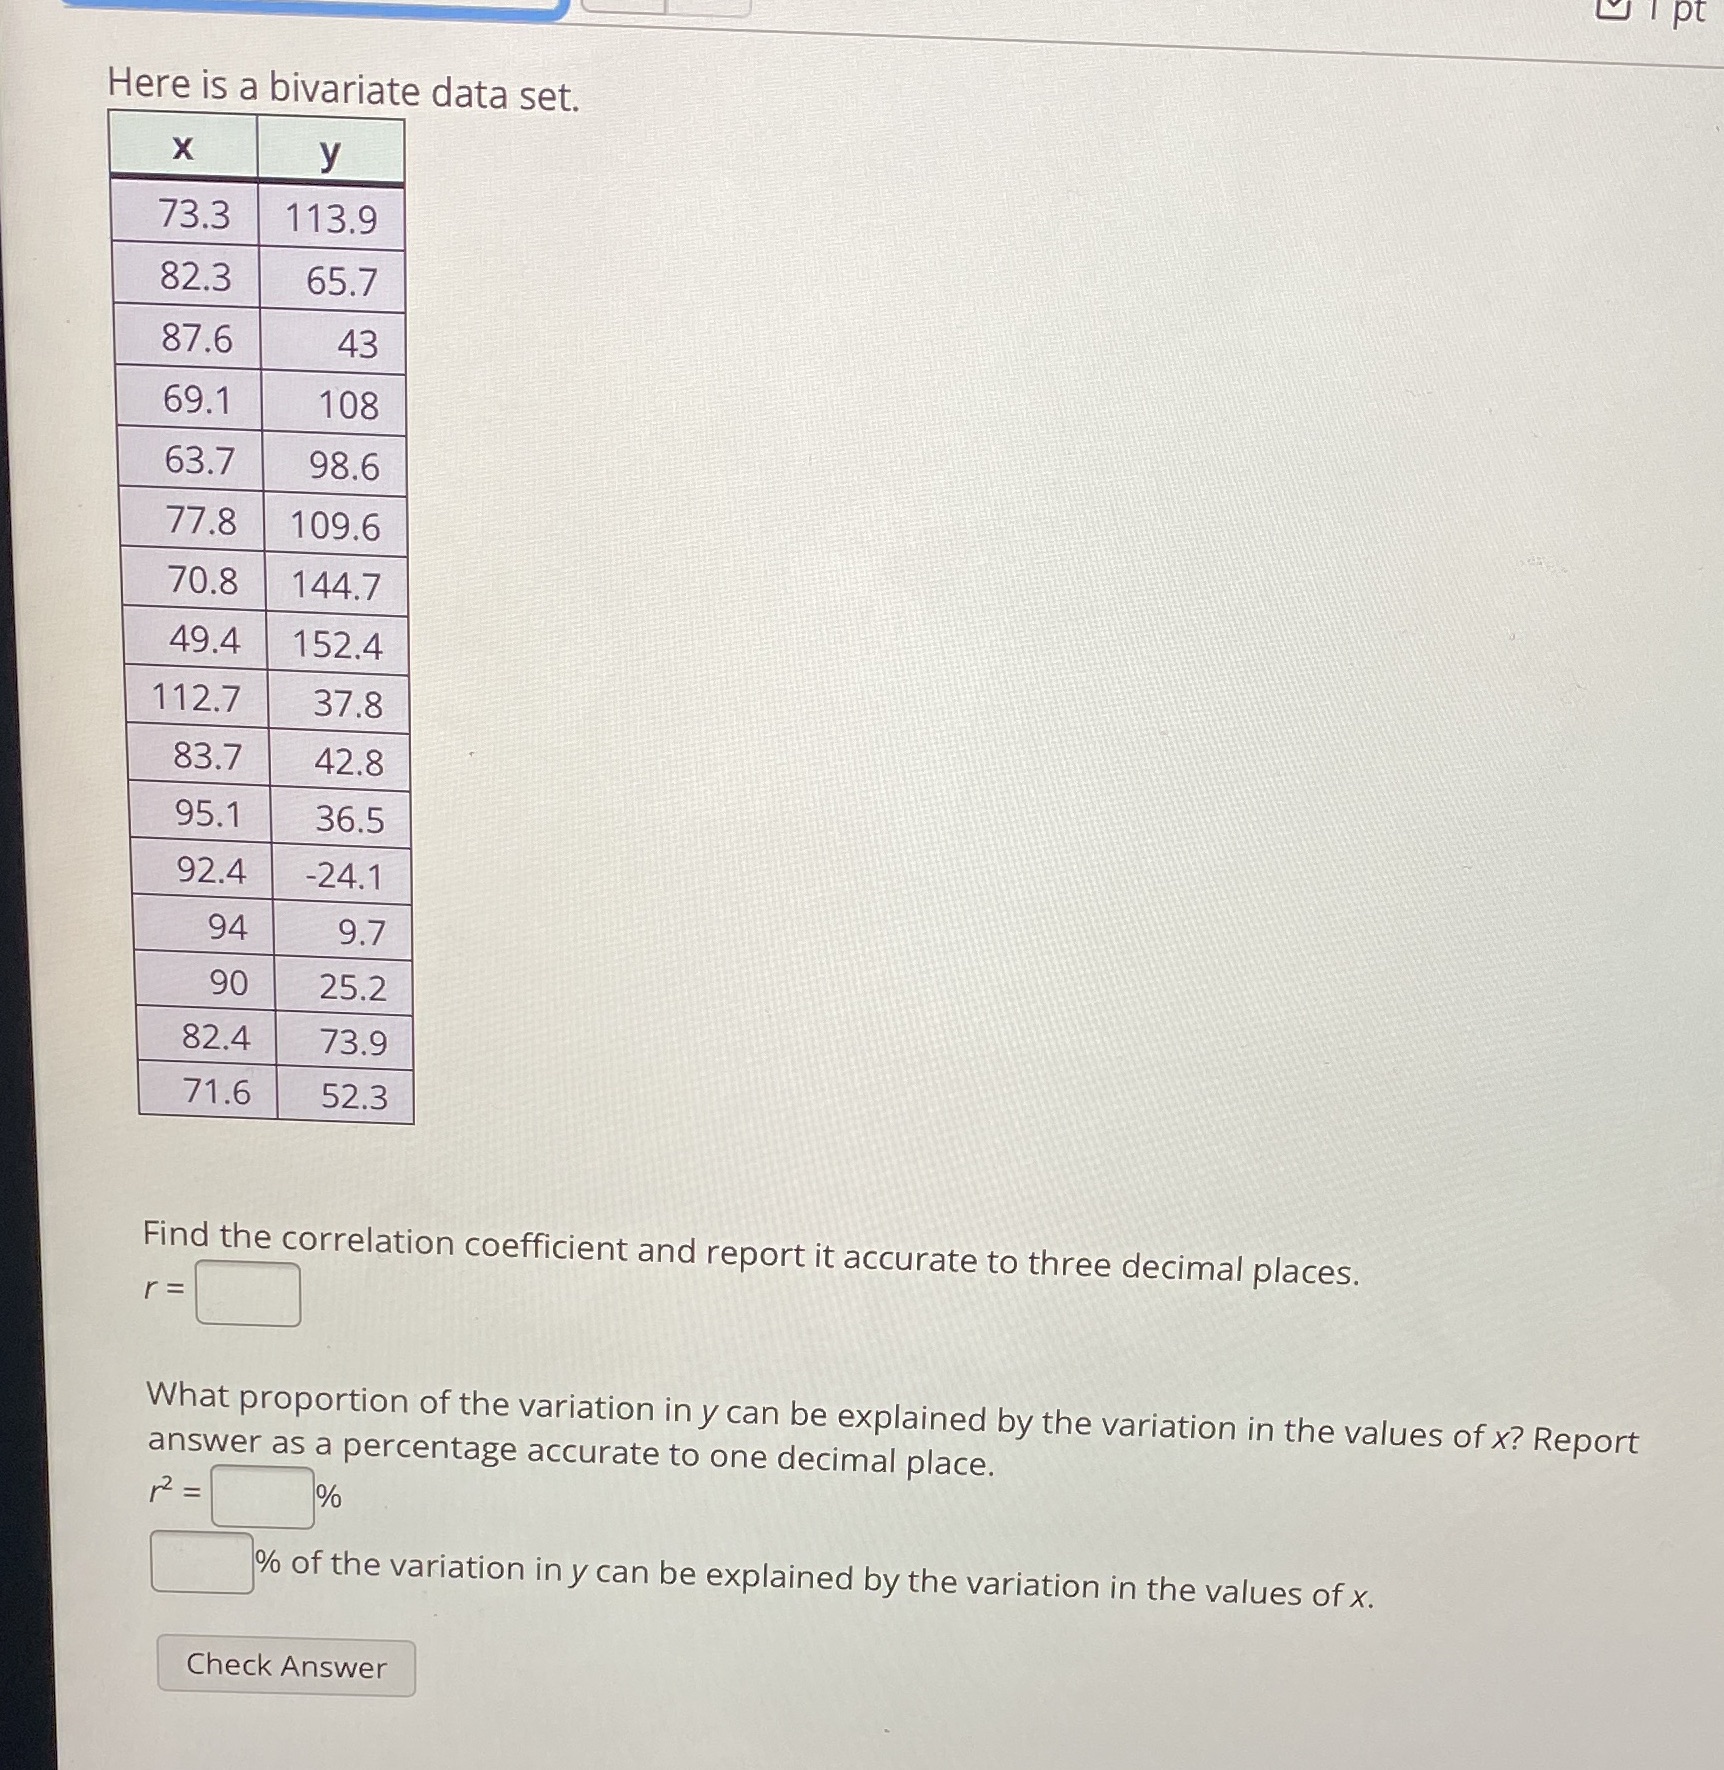
pt Here is a bivariate data set. X y 73.3 113.9 82.3 65.7 87.6 43 69.1 108 63.7 98.6 77.8 109.6 70.8 144.7 49.4 152.4 112.7 37 .8 83.7 42.8 95.1 36.5 92.4 24.1 94 9.7 90 25.2 82.4 73.9 71.6 52.3 Find the correlation coefficient and report it accurate to three decimal places. What proportion of the variation in y can be explained by the variation in the values of x? Report answer as a percentage accurate to one decimal place. 12 = 1 % % of the variation in y can be explained by the variation in the values of x. Check
Step by Step Solution
There are 3 Steps involved in it
1 Expert Approved Answer
Step: 1 Unlock

Question Has Been Solved by an Expert!
Get step-by-step solutions from verified subject matter experts
Step: 2 Unlock
Step: 3 Unlock