

Question: pter 1 4 Homework: Resource Management Chapman Pharmaceuticals, a large manufacturer of drugs, has this aggregate demand forecast ( in thousands of liters ) for
pter Homework: Resource Management
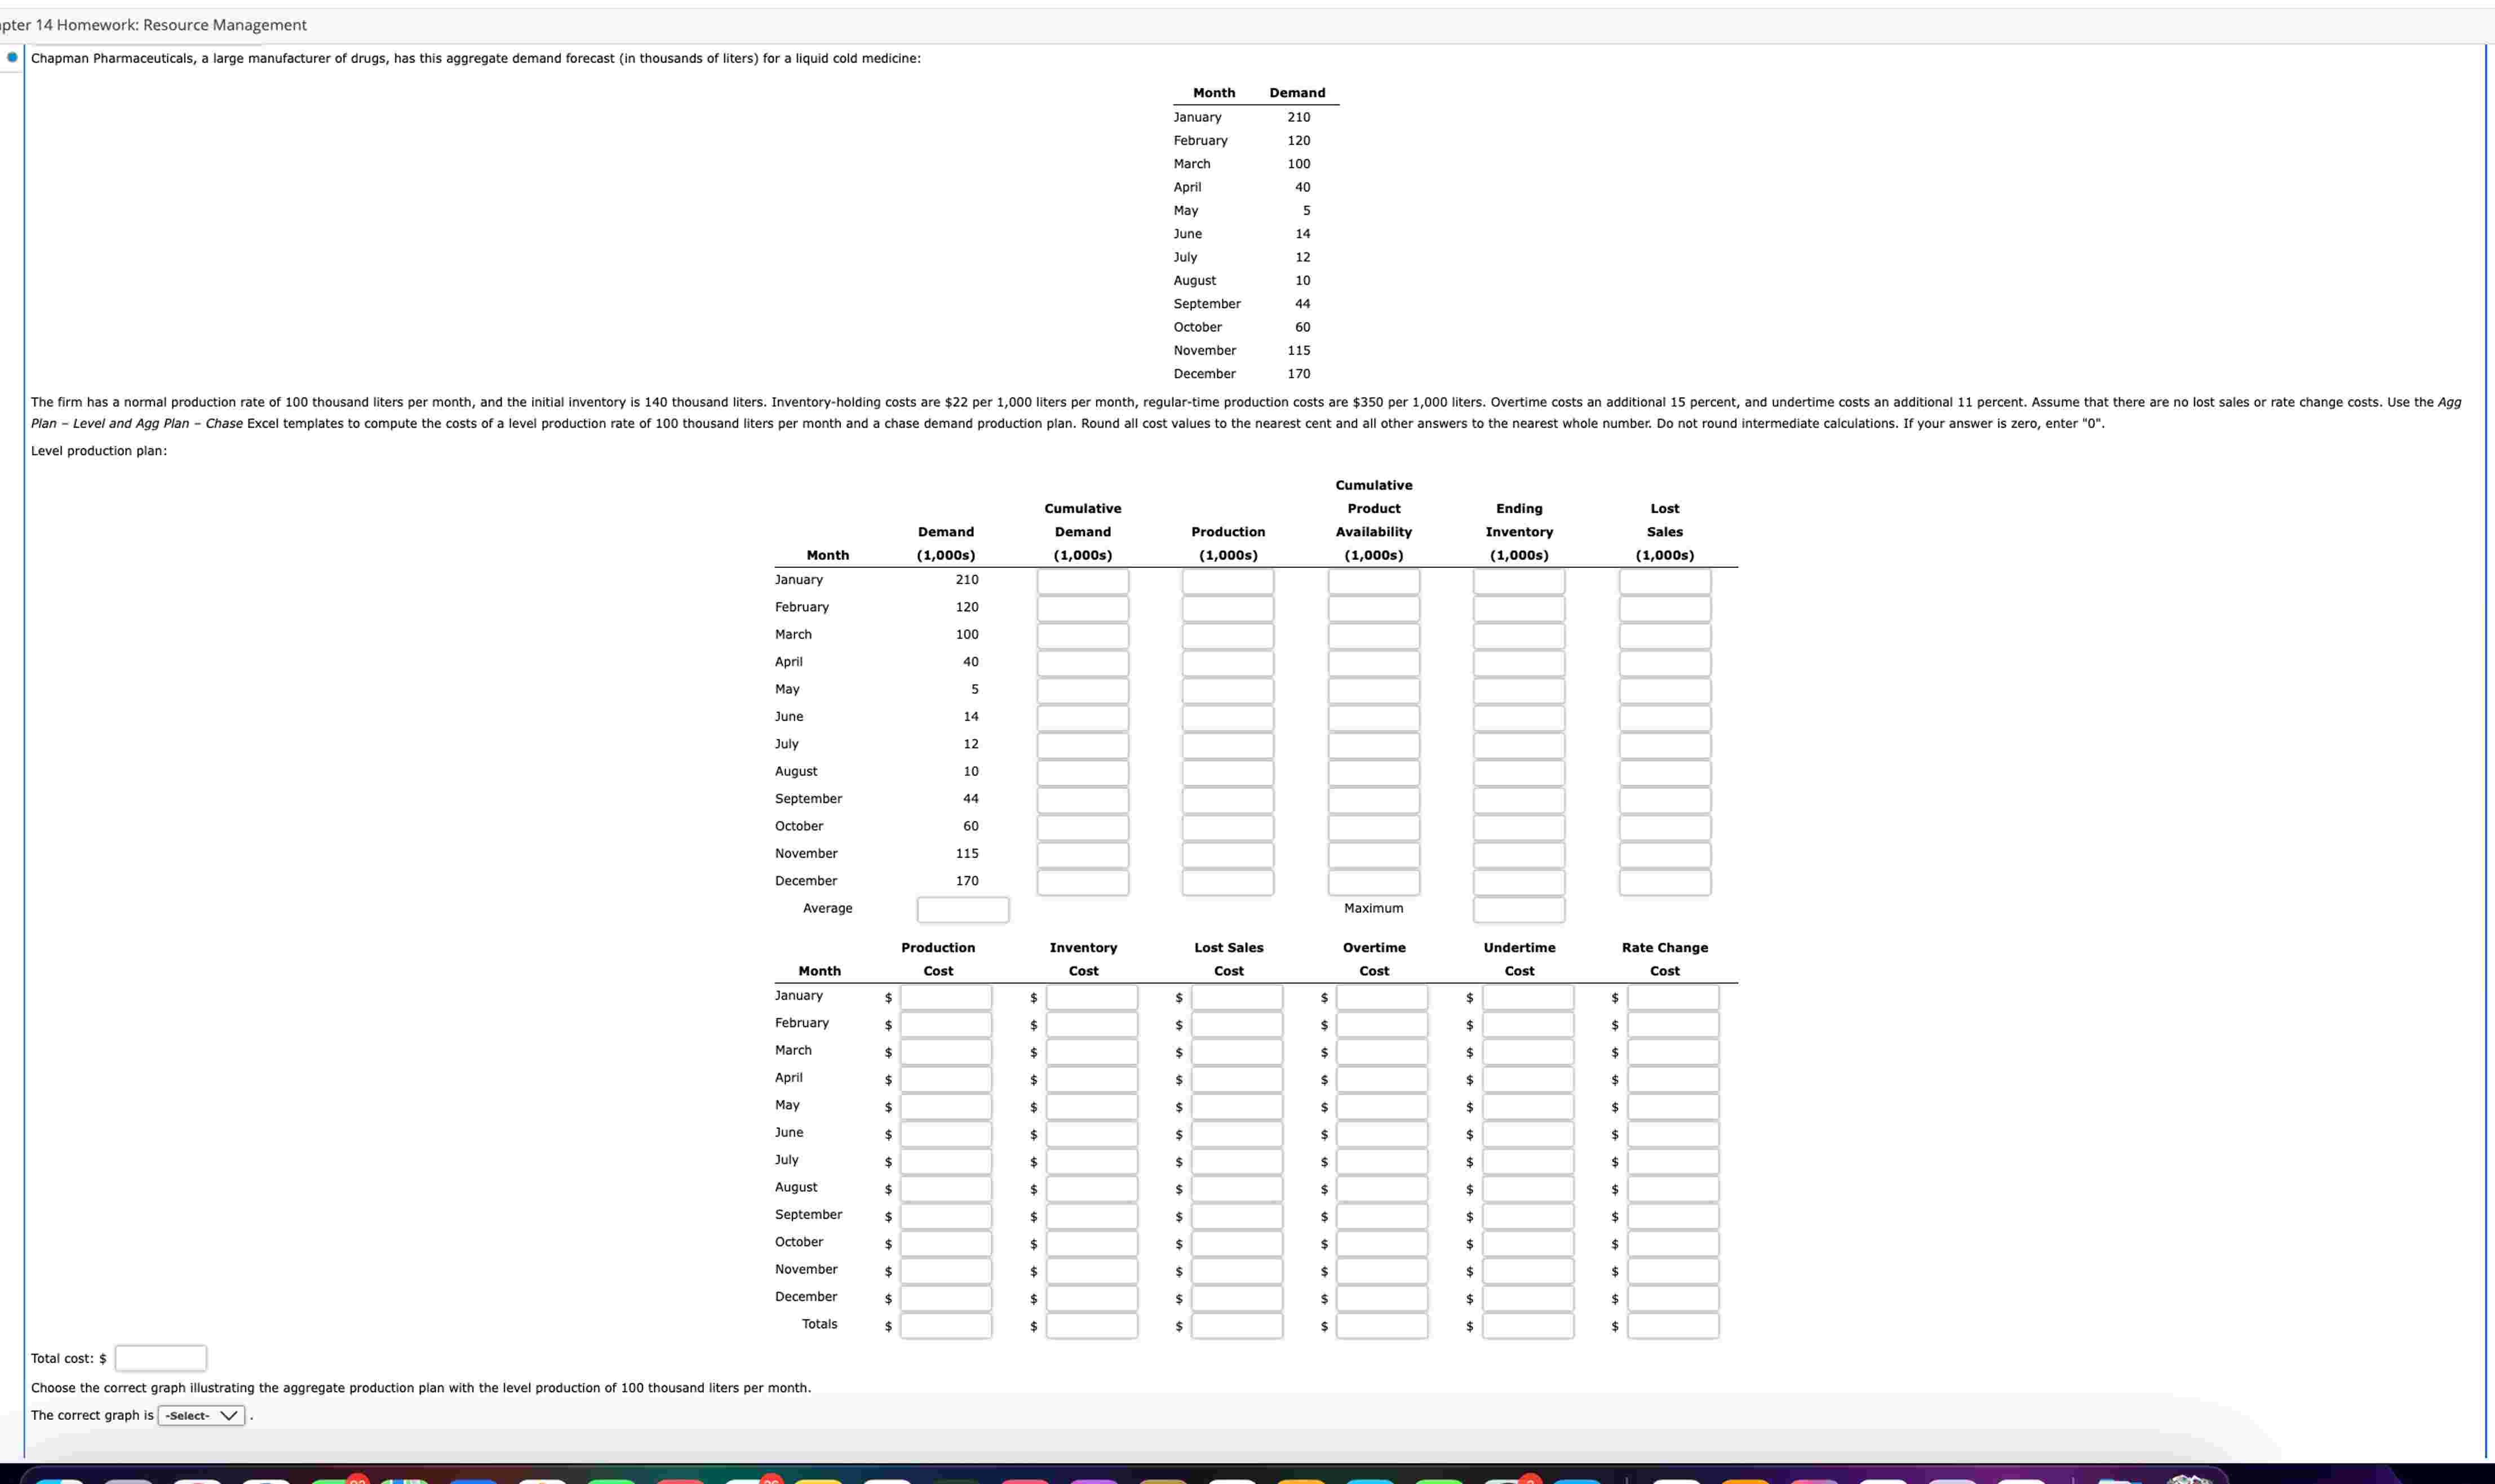
Chapman Pharmaceuticals, a large manufacturer of drugs, has this aggregate demand forecast in thousands of liters for a liquid cold medicine:
begintabularlc
multicolumnc Month & Demand
hline January &
February &
March &
April &
May &
June &
July &
August &
September &
October &
November &
December &
endtabular
Level production plan:
Total cost: $
Choose the correct graph illustrating the aggregate production plan with the level production of thousand liters per month.
The correct graph is SelectmathbfV
Step by Step Solution
There are 3 Steps involved in it
1 Expert Approved Answer
Step: 1 Unlock

Question Has Been Solved by an Expert!
Get step-by-step solutions from verified subject matter experts
Step: 2 Unlock
Step: 3 Unlock