

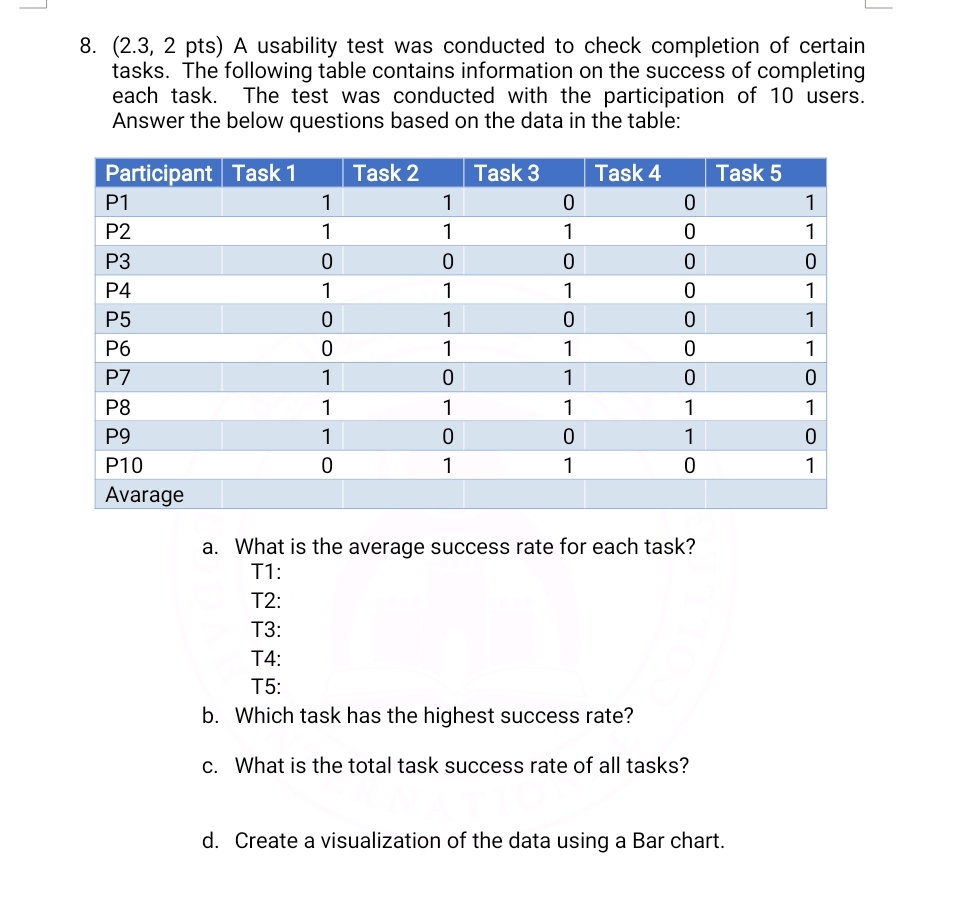
Question: pts ) A usability test was conducted to check completion of certain tasks. The following table contains information on the success of completing each task.
pts A usability test was conducted to check completion of certain tasks. The following table contains information on the success of completing each task. The test was conducted with the participation of users. Answer the below questions based on the data in the table:
tableParticipantTask Task Task Task Task PPPPPPPPPPAvarage
a What is the average success rate for each task?
T:
T:
:
T:
T:
b Which task has the highest success rate?
c What is the total task success rate of all tasks?
d Create a visualization of the data using a Bar chart.
Step by Step Solution
There are 3 Steps involved in it
1 Expert Approved Answer
Step: 1 Unlock

Question Has Been Solved by an Expert!
Get step-by-step solutions from verified subject matter experts
Step: 2 Unlock
Step: 3 Unlock