

Question: PUS A8.p 0 Com Com = Com Anti Final + Com Quiz ITBS NYU Albe M Inbc M (6e3 3an Cou | + PDF
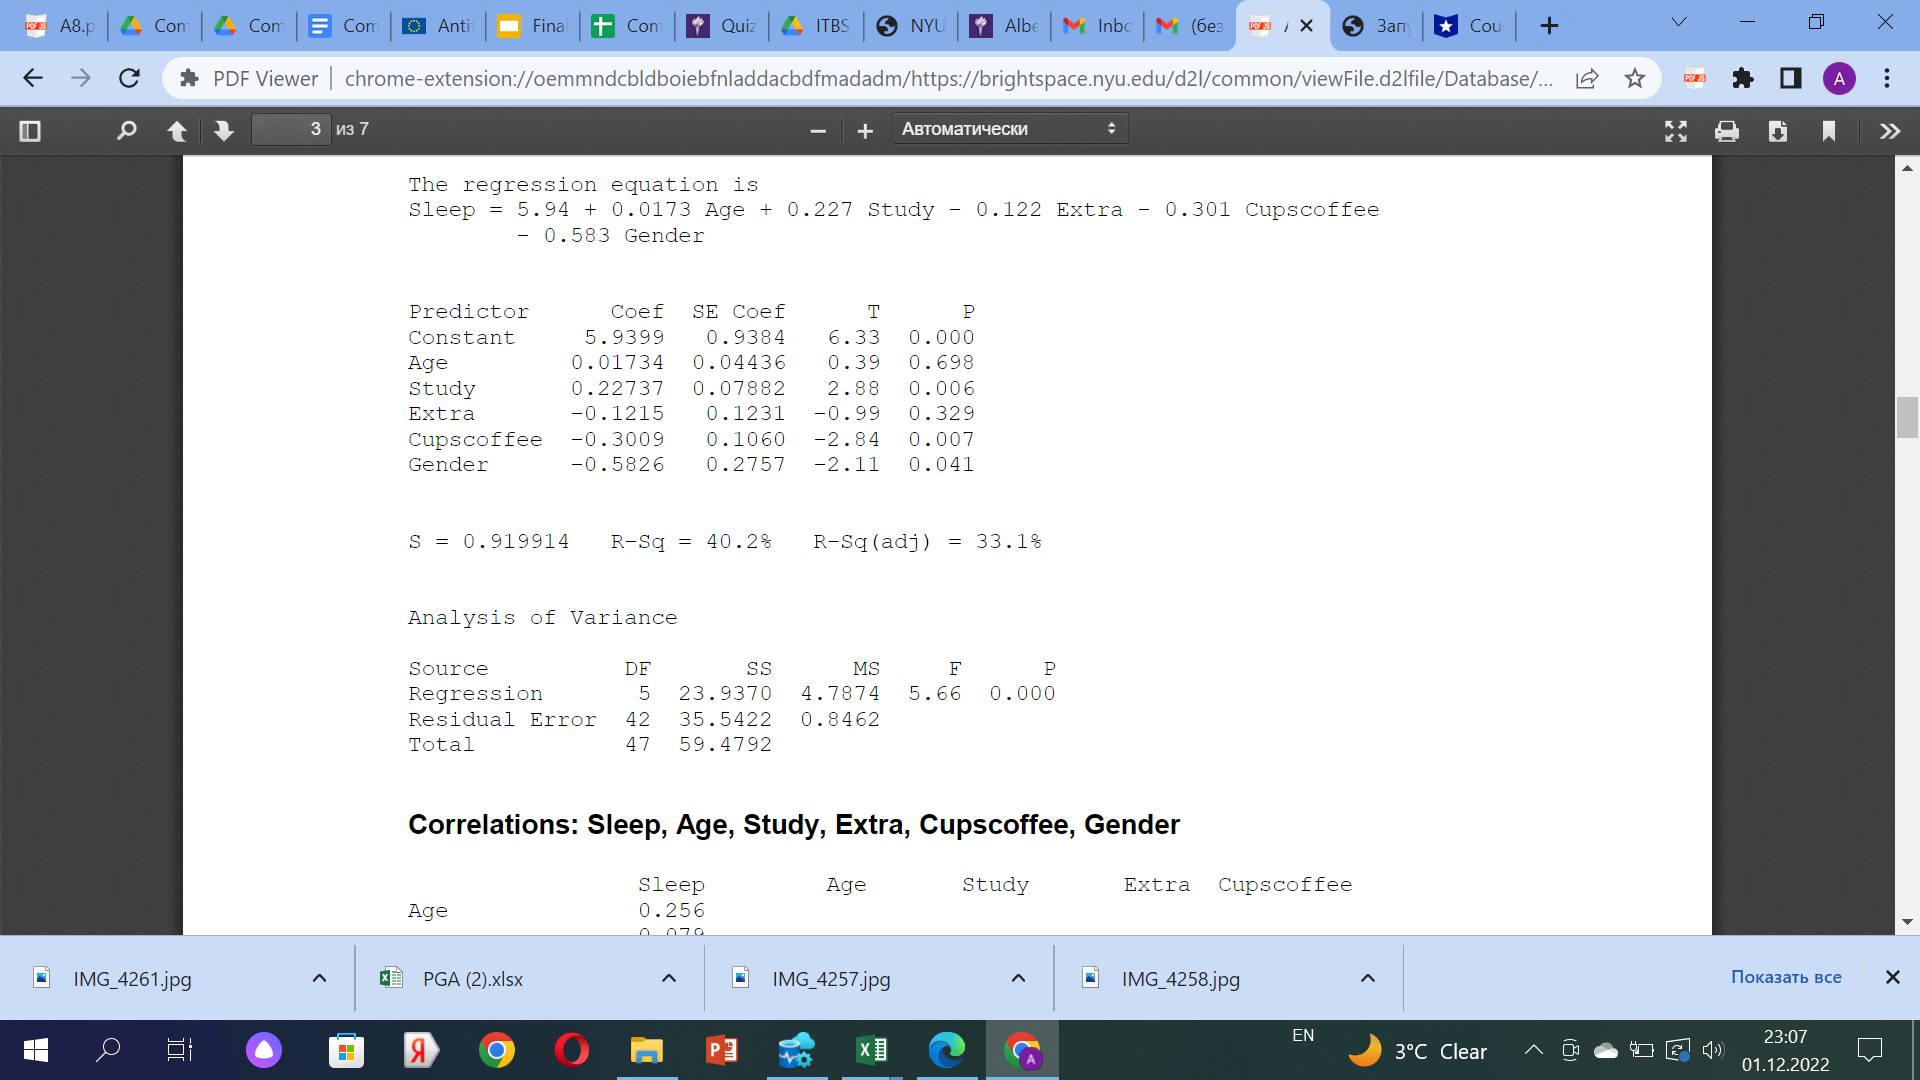
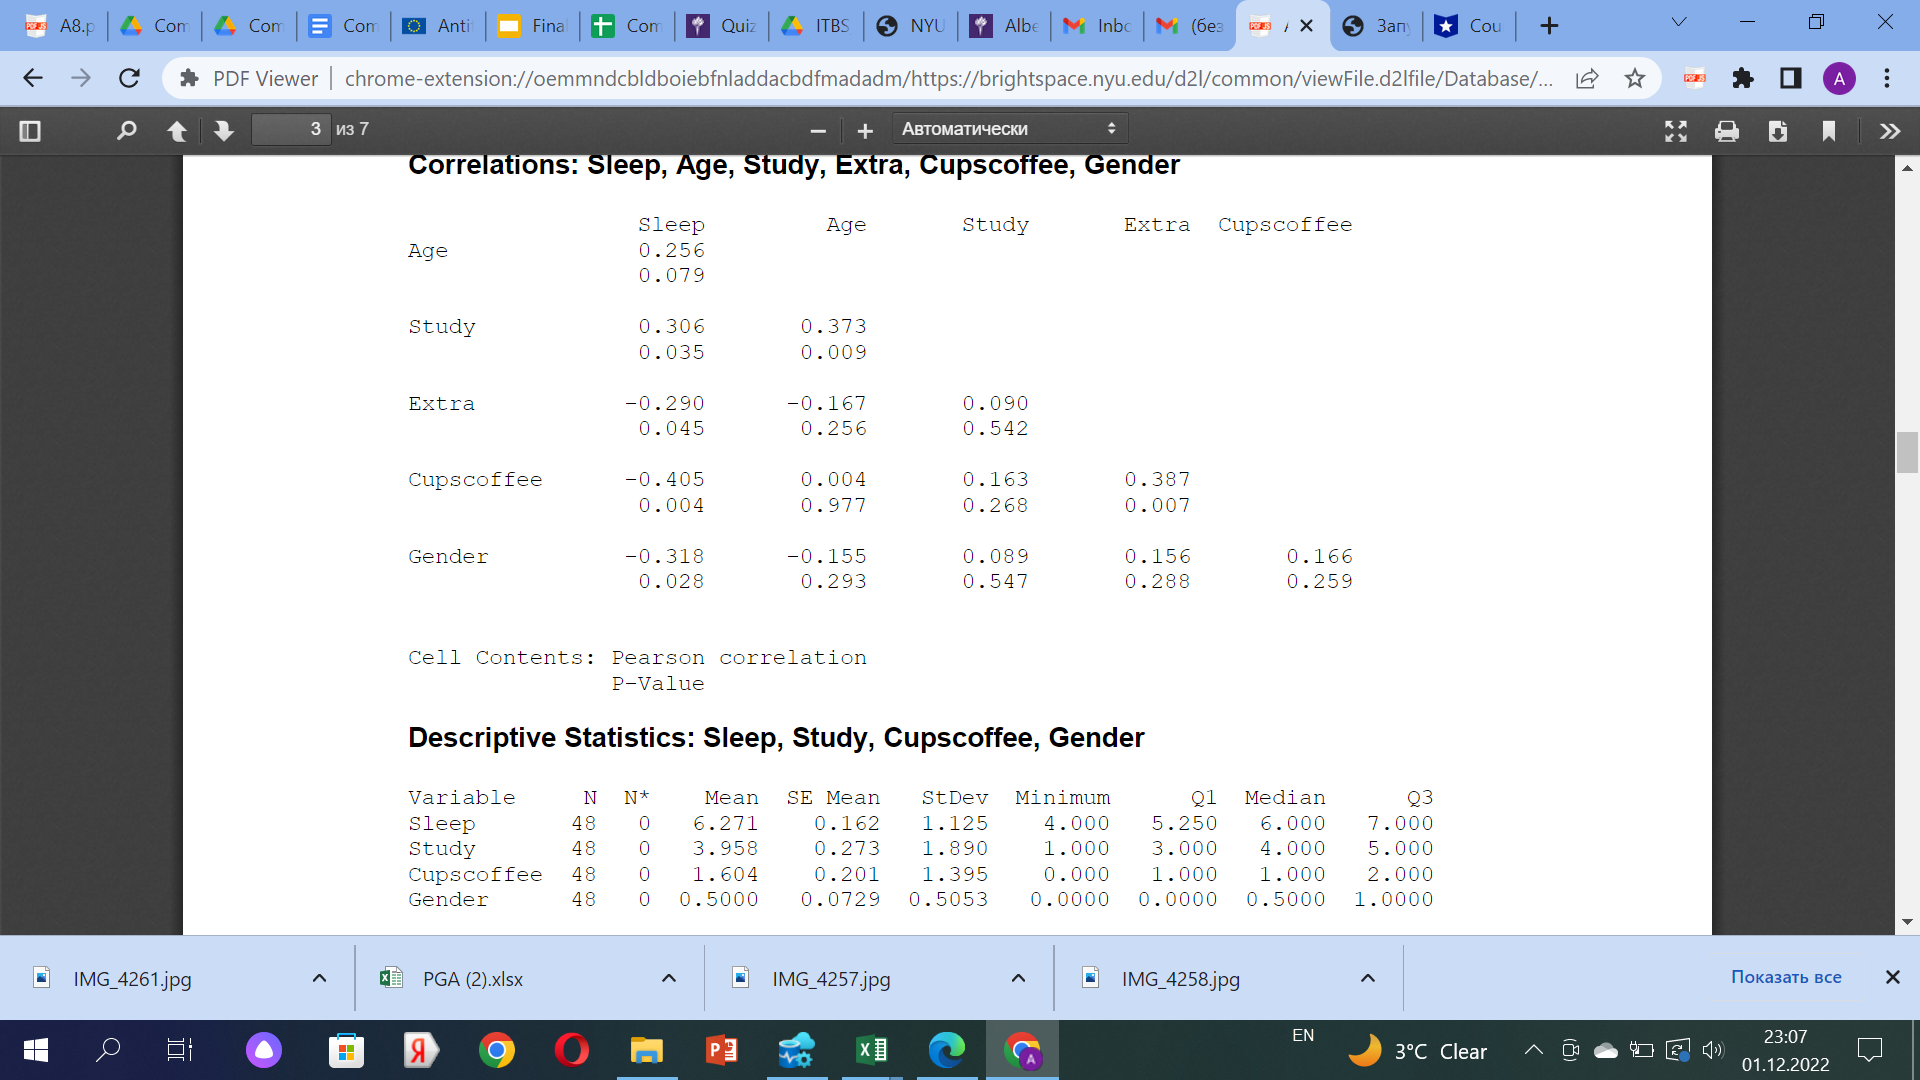
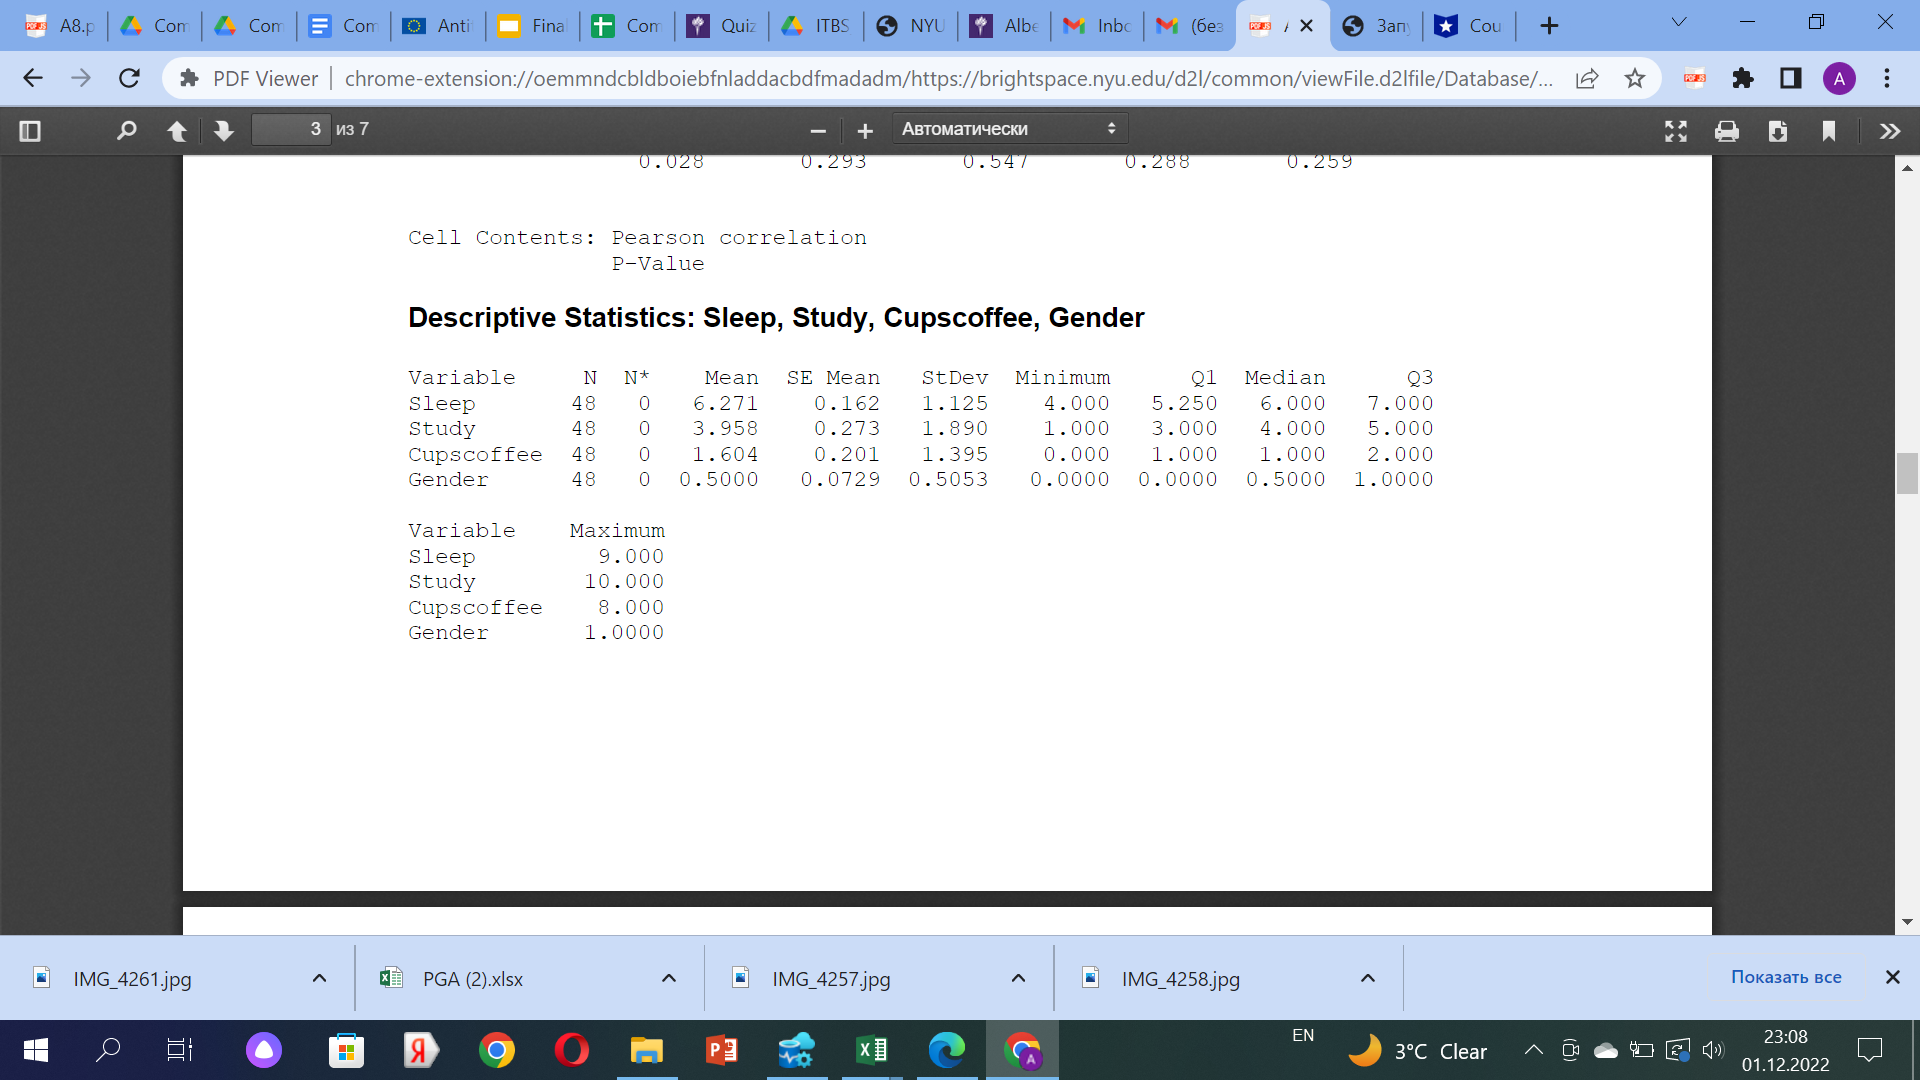
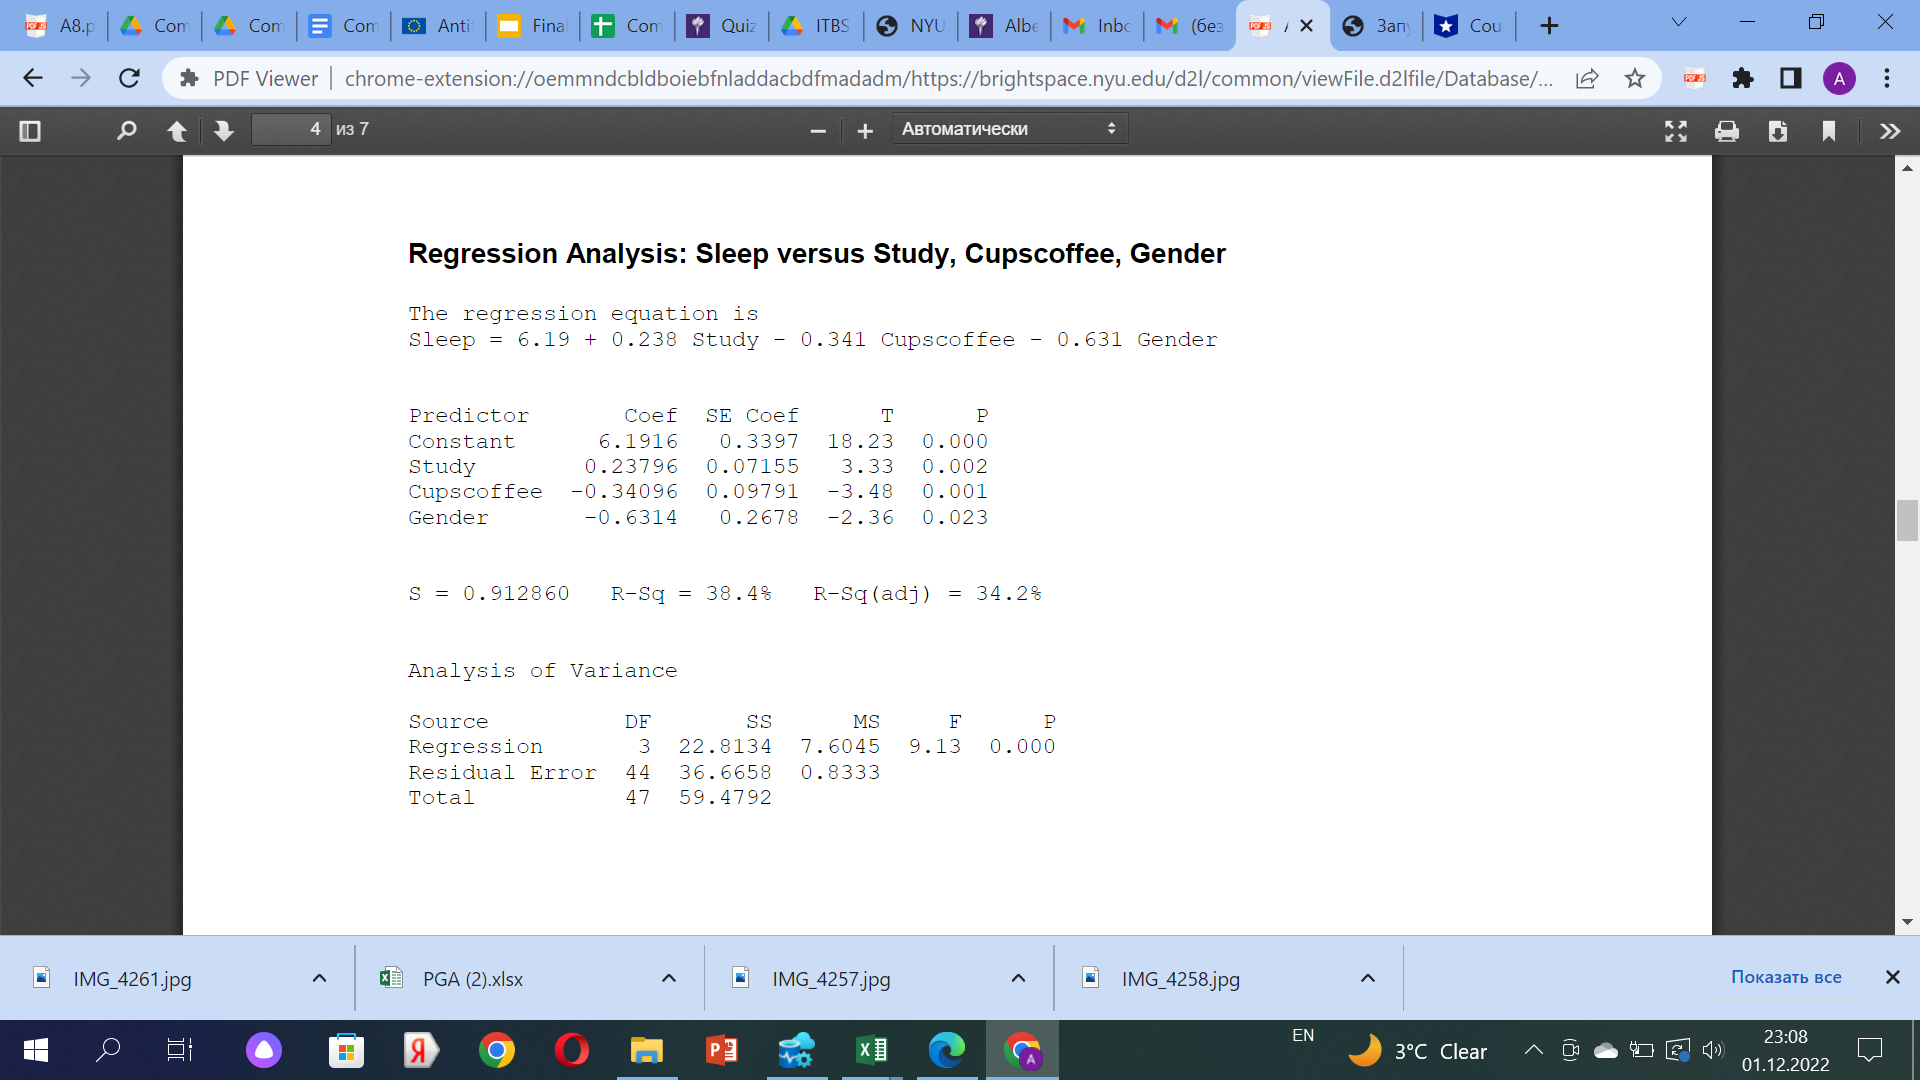
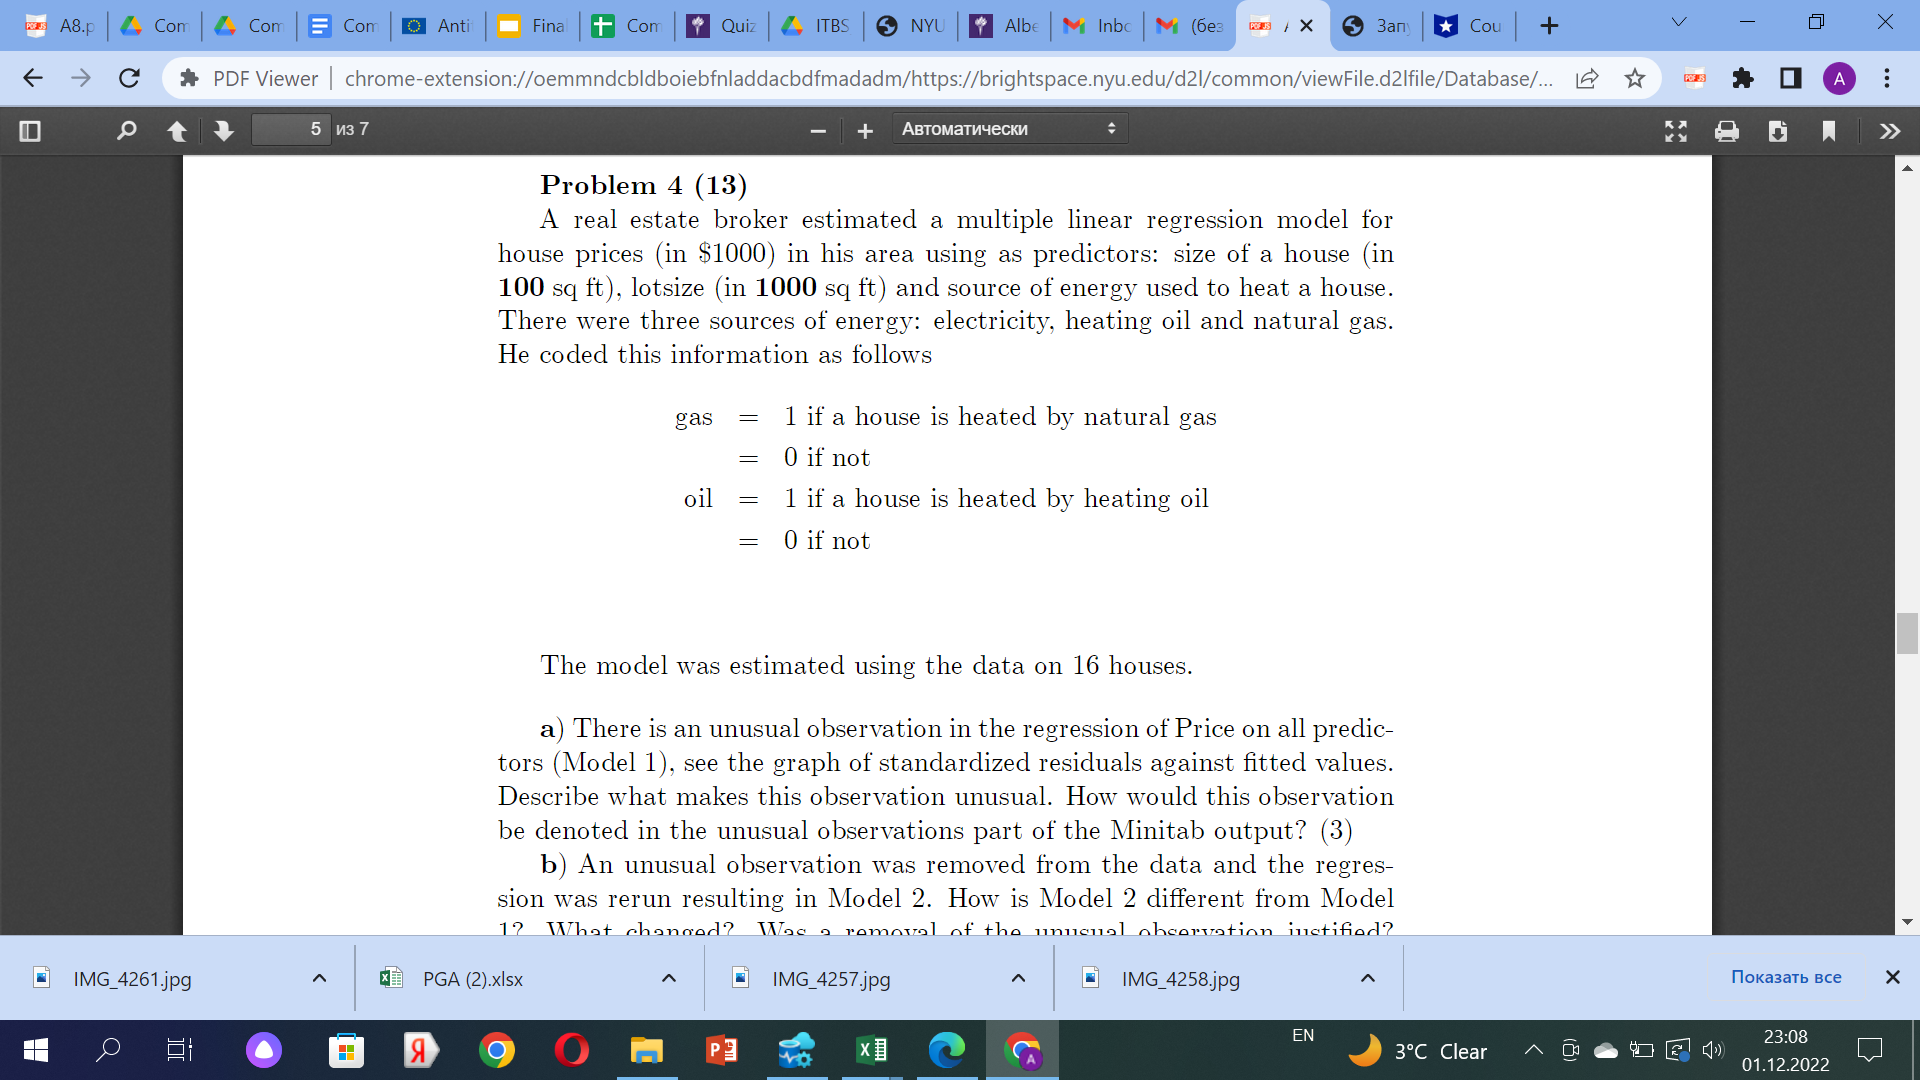
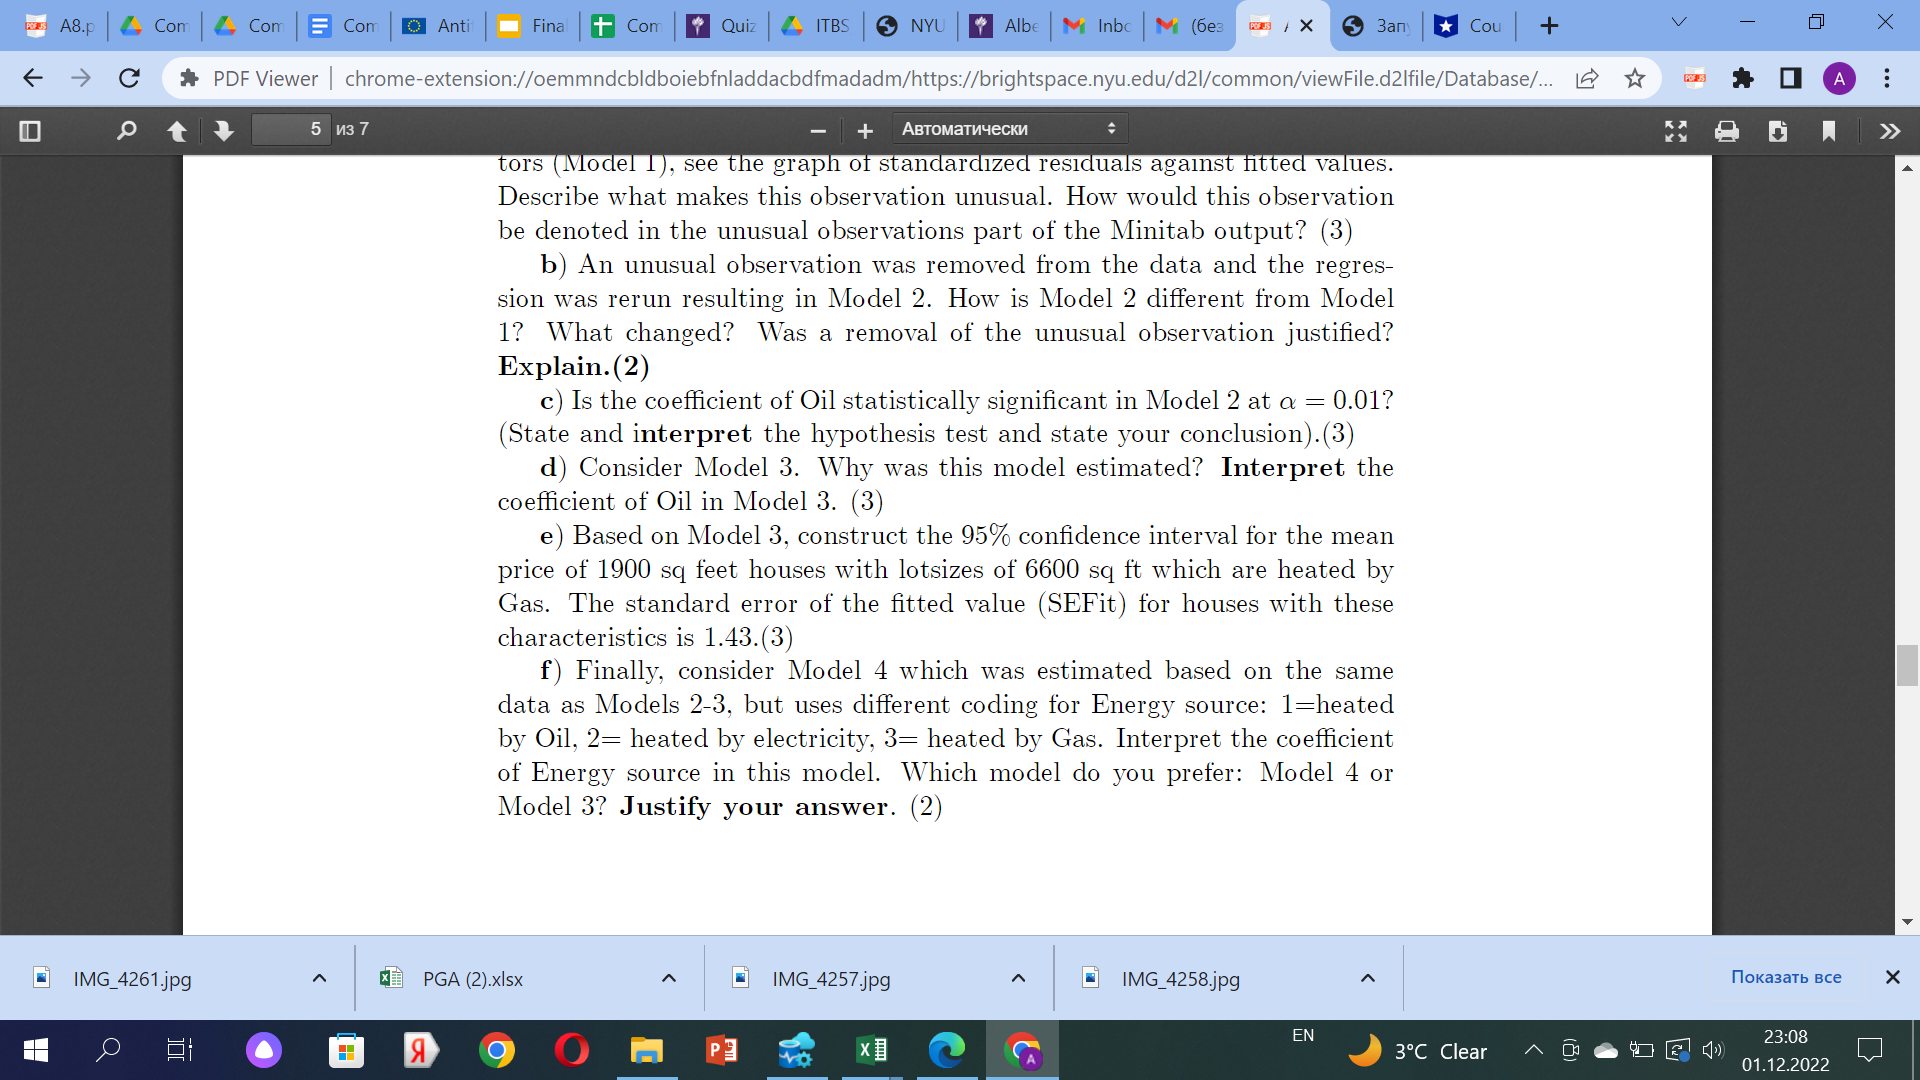
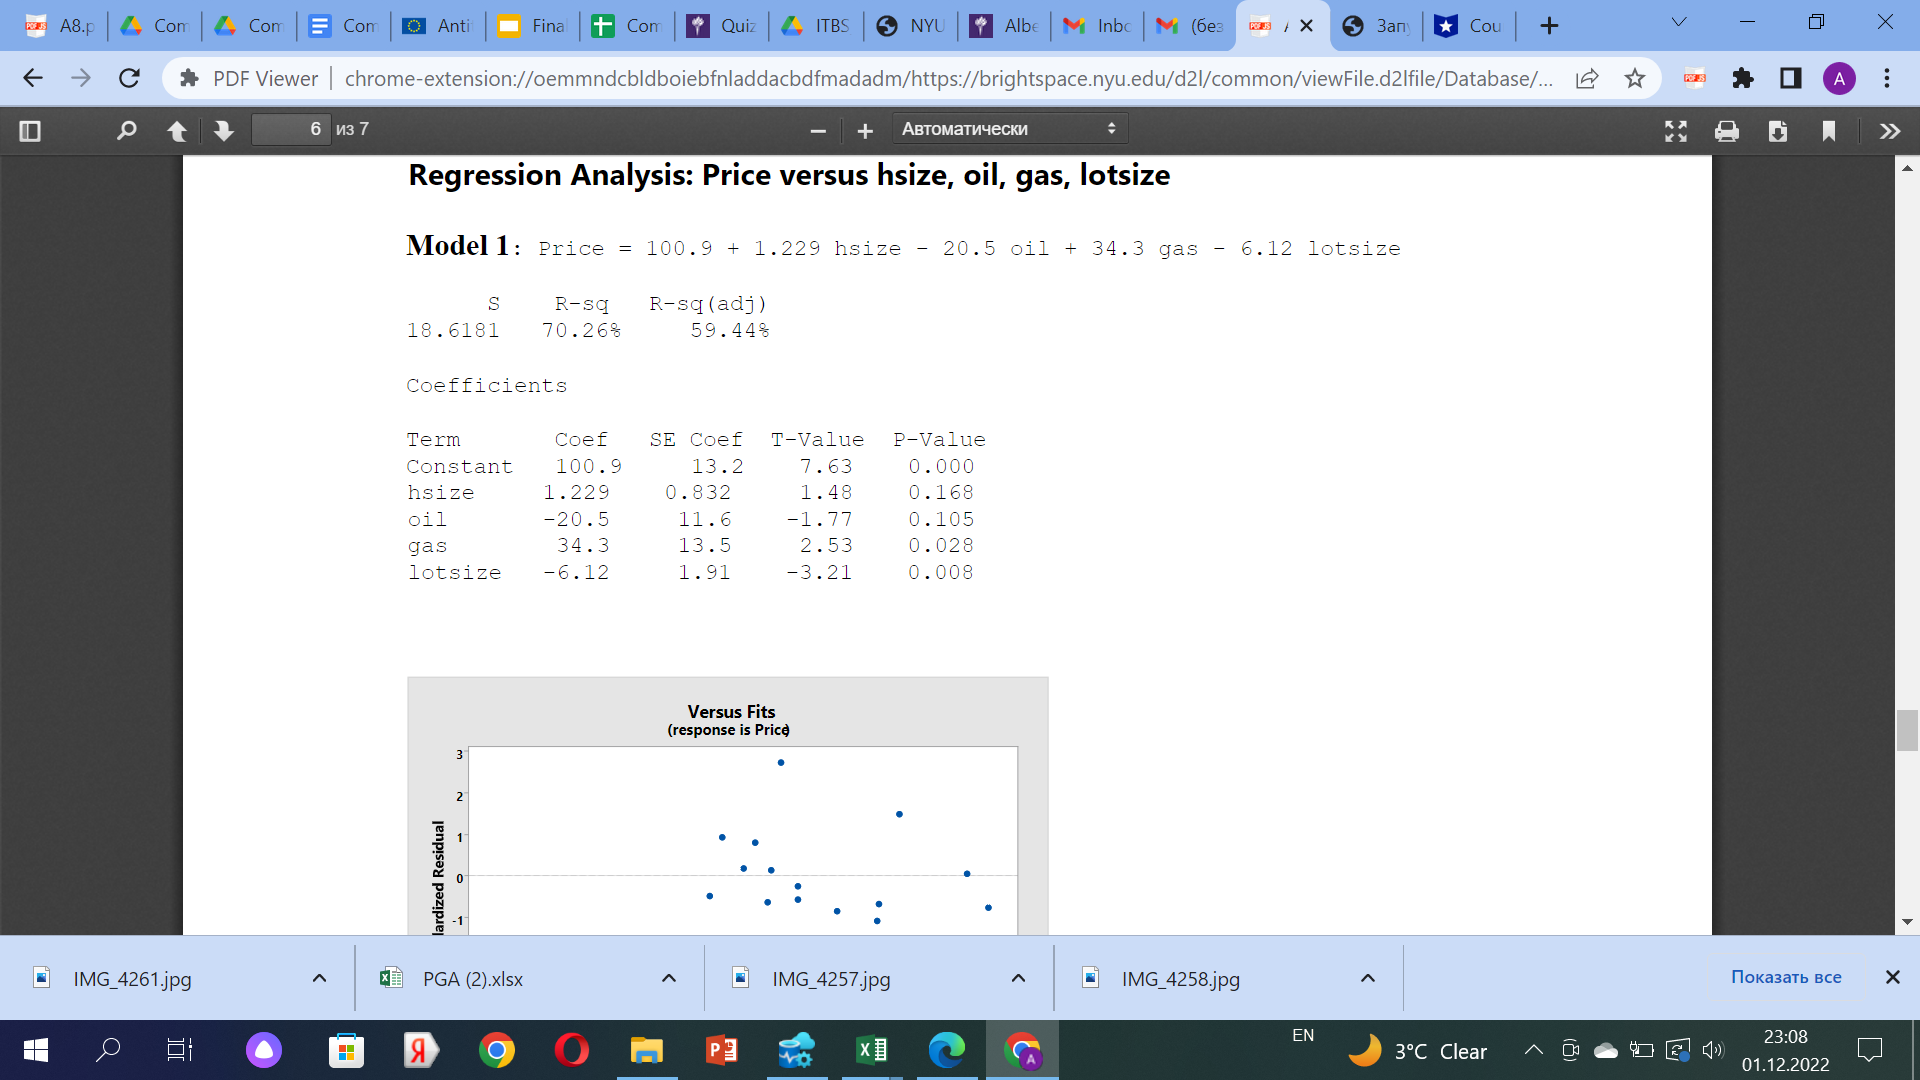
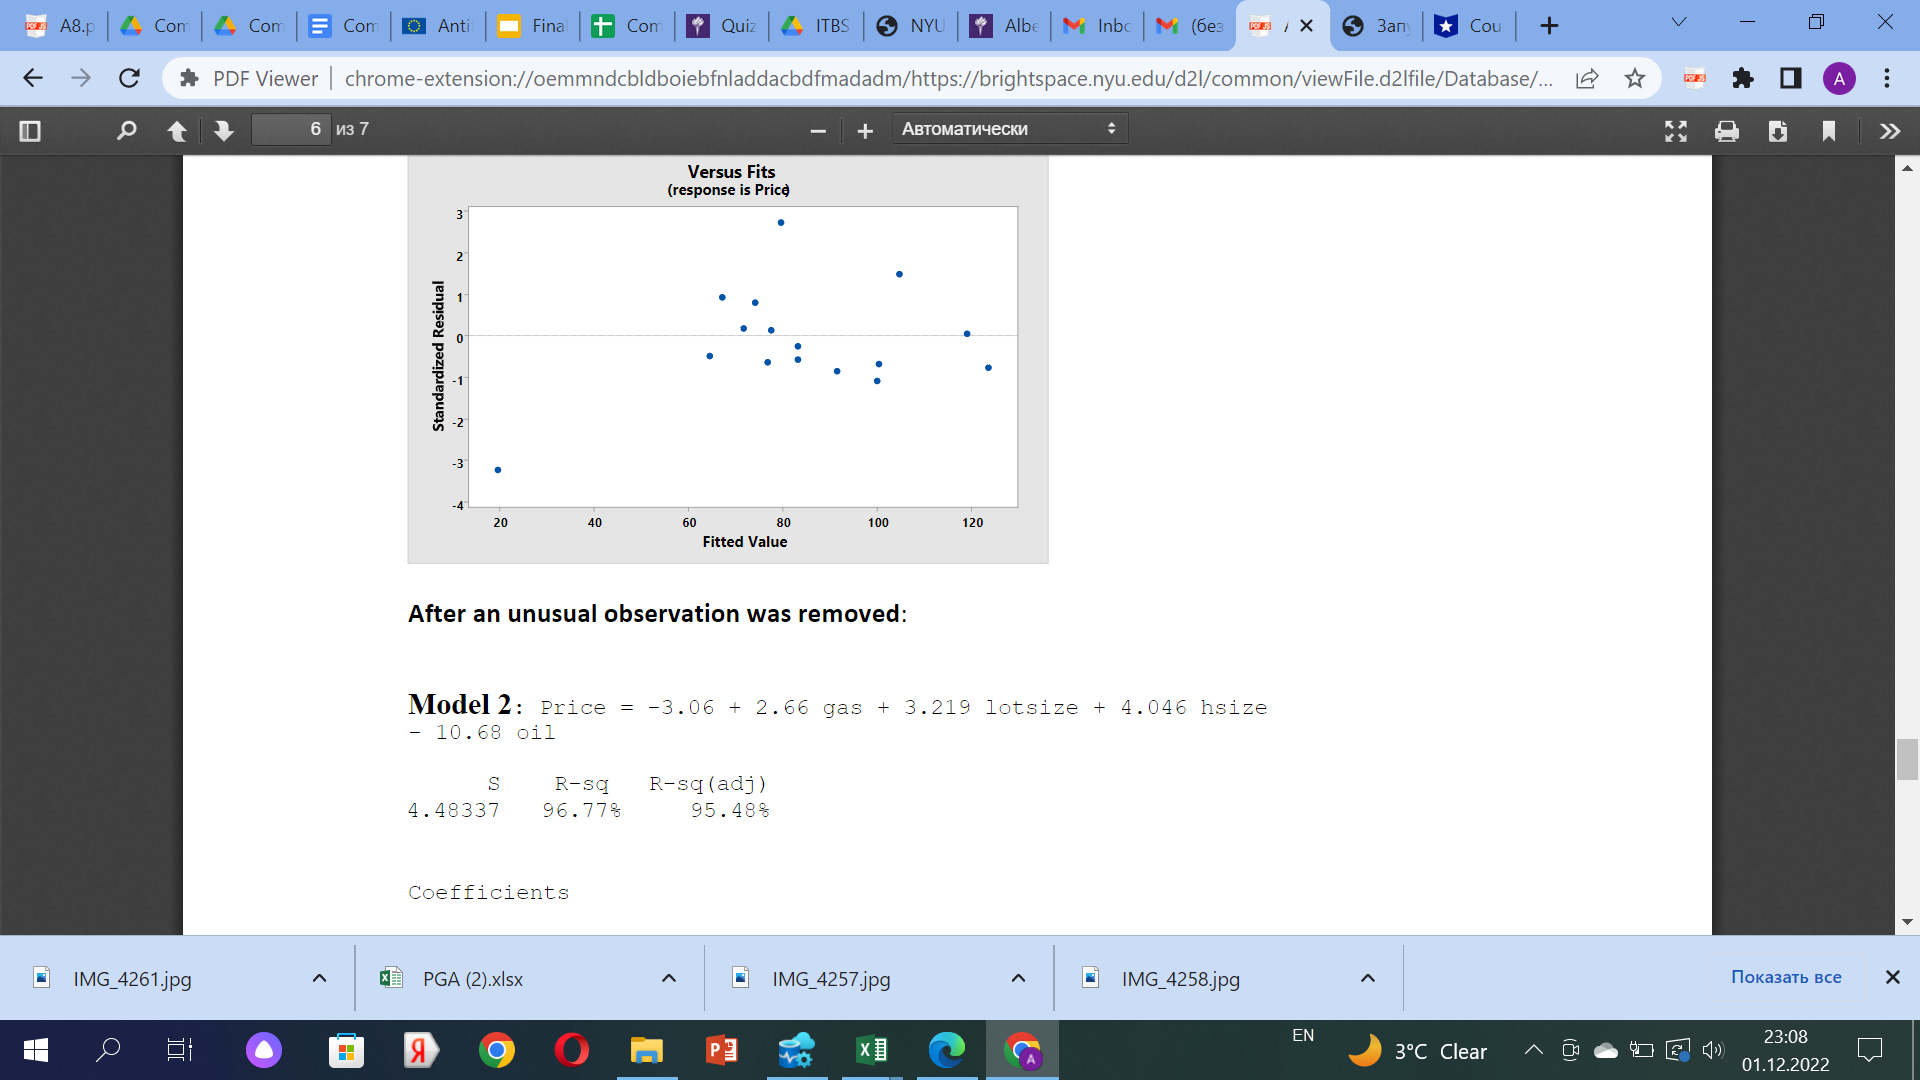
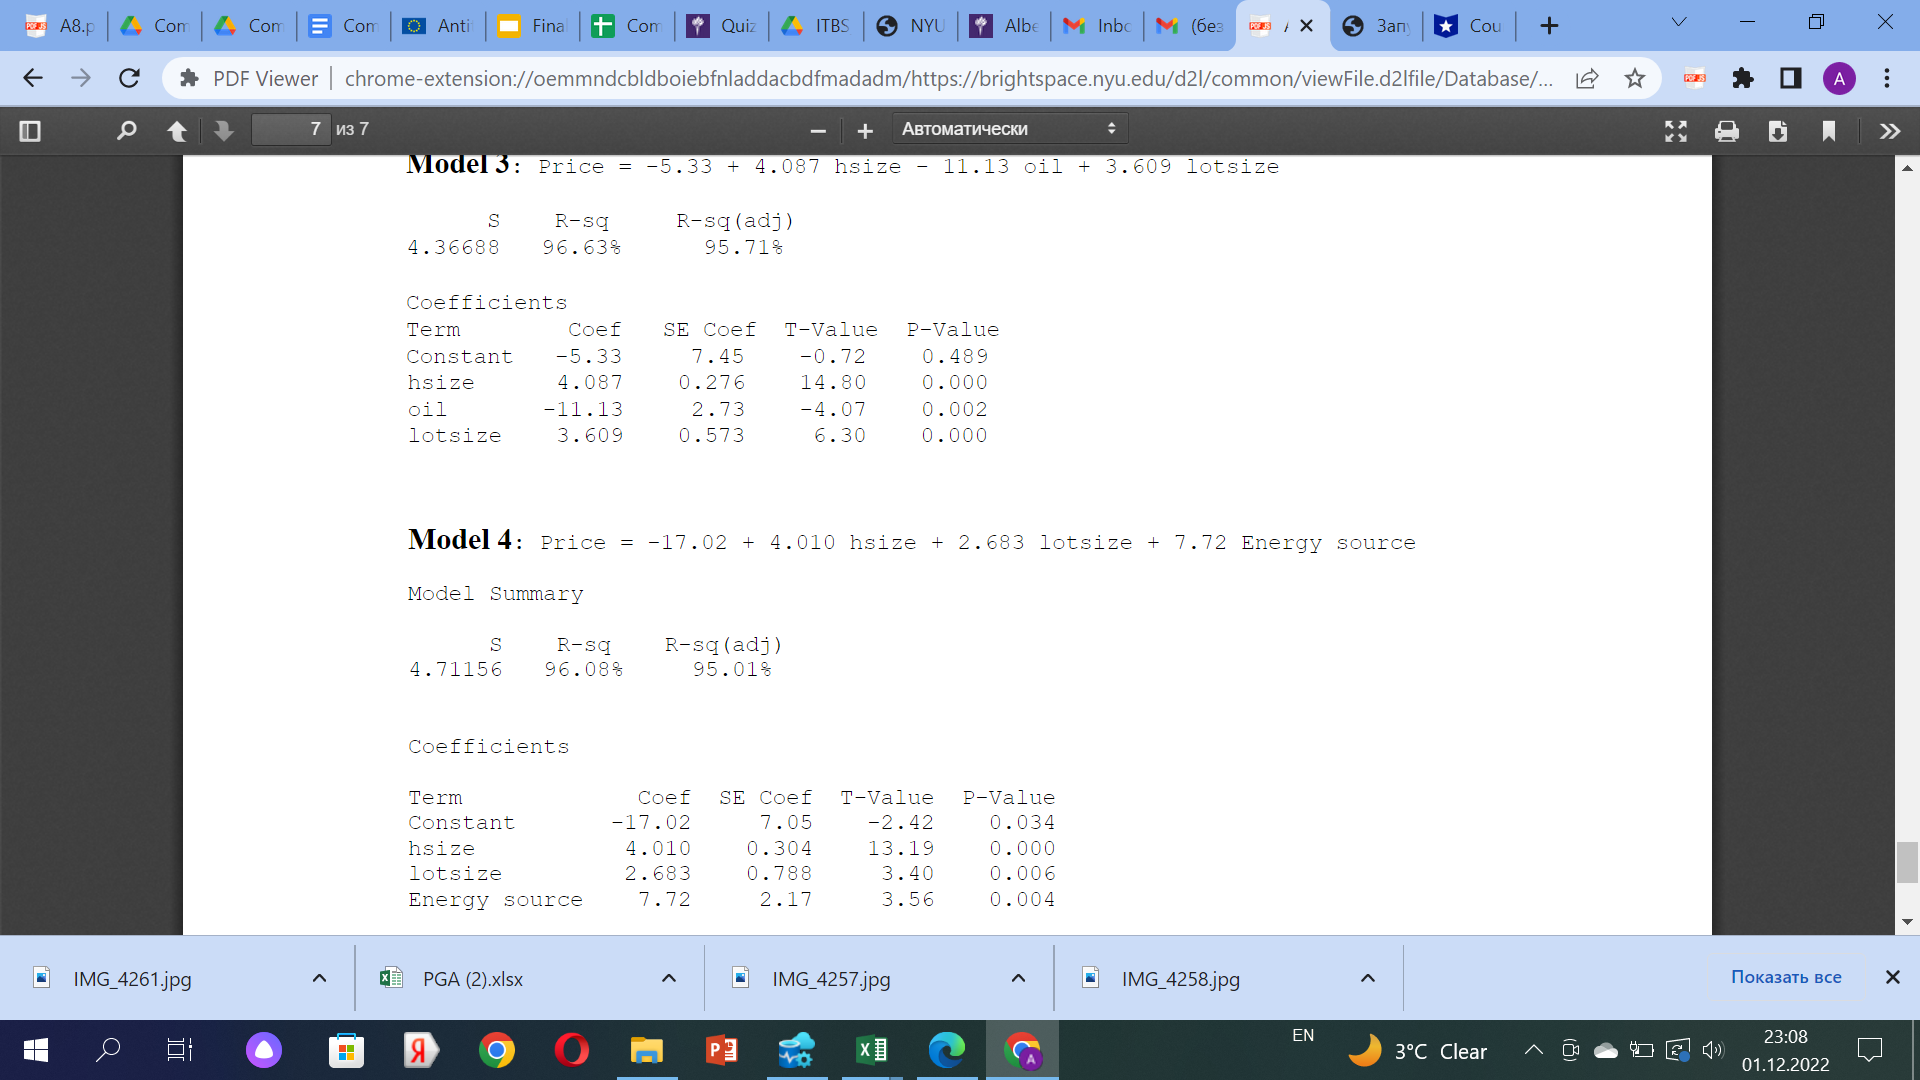
PUS A8.p 0 Com Com = Com Anti Final + Com Quiz ITBS NYU Albe M Inbc M (6e3 3an Cou | + PDF Viewer chrome-extension://oemmndcbldboiebfnladdacbdfmadadm/https://brightspace.nyu.edu/d2l/common/viewFile.d2lfile/Database/... IMG_4261.jpg 2 7 Now consider the estimated multiple regression model with all predictors. d) Which two predictors are most highly correlated with each other? Which two are the least correlated with each other? (2) e) Why is Extra not statistically significant in the multiple regression model at a = 0.05 even though it is statistically significant, at a = 0.05, in the simple regression of Sleep on Extra? (Give a possible reason.) (2) f) The students decided to use the three-predictors model as their final model. Explain their decision. (2) g) Based on the three-predictors final model interpret the coefficient of Study. Is your interpretation valid? (Explain) (2) Problem 3 (6) This problem refers to the data in Problem 2 a) Before collecting the data the students thought that the mean sleep time for the population of NYU undergraduate students is 7 hours. Is there evidence in the data, at a = = 0.05, that they were not correct? (State the hypothesis test and your conclusion.) (3) b) Find the p-value for the test in a) and interpret it. (3) PGA (2).xlsx IMG_4257.jpg IMG_4258.jpg P x EN 3C Clear ^ (8) POFUS A 23:07 01.12.2022 PUS A8.p Com Com = Com Anti Final + Com Quiz ITBS NYU * Albe M Inbc | M (6e3 3an Cou | + 0 PDF Viewer chrome-extension://oemmndcbldboiebfnladdacbdfmadadm/https://brightspace.nyu.edu/d2l/common/viewFile.d2lfile/Database/... IMG_4261.jpg 3 7 ^ The regression equation is Sleep = 5.94 + 0.0173 Age + 0.227 Study - 0.583 Gender - 0.122 Extra - 0.301 Cupscoffee Predictor Constant Age Study Coef SE Coef 5.9399 0.9384 0.01734 0.04436 0.22737 0.07882 Extra -0.1215 0.1231 Cupscoffee -0.3009 Gender -0.5826 T 6.33 0.000 0.39 0.698 2.88 0.006 -0.99 0.329 0.1060 -2.84 0.007 0.2757 -2.11 0.041 S = 0.919914 R-Sq 40.2% Analysis of Variance R-Sq (adj) = 33.1% Source DF SS MS Regression 5 Residual Error 42 Total 23.9370 35.5422 47 59.4792 4.7874 0.8462 F 5.66 P 0.000 Correlations: Sleep, Age, Study, Extra, Cupscoffee, Gender Age PGA (2).xlsx Sleep 0.256 0070 Age Study Extra Cupscoffee P IMG_4257.jpg IMG_4258.jpg EN 3C Clear ^ (8) POFUS A 23:07 01.12.2022 PUS A8.p Com Com = Com Anti Final + Com Quiz ITBS NYU Albe M Inbc M (6e3 3an Cou | + 0 PDF Viewer chrome-extension://oemmndcbldboiebfnladdacbdfmadadm/https://brightspace.nyu.edu/d2l/common/viewFile.d2lfile/Database/... IMG_4261.jpg 3 7 + Correlations: Sleep, Age, Study, Extra, Cupscoffee, Gender Sleep Age Study Extra Cupscoffee Age 0.256 0.079 Study 0.306 0.373 0.035 0.009 Extra -0.290 -0.167 0.090 0.045 0.256 0.542 Cupscoffee -0.405 0.004 0.163 0.387 0.004 0.977 0.268 0.007 Gender -0.318 0.028 -0.155 0.293 0.089 0.156 0.547 0.288 0.166 0.259 Cell Contents: Pearson correlation P-Value Descriptive Statistics: Sleep, Study, Cupscoffee, Gender Variable N N* Mean Sleep 48 0 6.271 SE Mean 0.162 StDev Minimum 1.125 4.000 Q1 Median Q3 5.250 6.000 7.000 Study 48 0 3.958 0.273 1.890 1.000 3.000 4.000 5.000 Cupscoffee 48 0 1.604 Gender 48 0 0.5000 0.201 0.0729 1.395 0.5053 0.000 1.000 1.000 2.000 0.0000 0.0000 0.5000 1.0000 ^ PGA (2).xlsx IMG_4257.jpg P IMG_4258.jpg POFUS A EN 23:07 3C Clear ^ 01.12.2022 PUS A8.p Com Com = Com Anti Final + Com Quiz ITBS NYU Albe M Inbc M (6e3 3an 0 Cou | + PDF Viewer chrome-extension://oemmndcbldboiebfnladdacbdfmadadm/https://brightspace.nyu.edu/d2l/common/viewFile.d2lfile/Database/... 3 7 IMG_4261.jpg + 0.028 0.293 0.547 0.288 0.259 Cell Contents: Pearson correlation P-Value Descriptive Statistics: Sleep, Study, Cupscoffee, Gender Variable N N* Mean Sleep 48 0 6.271 SE Mean 0.162 StDev Minimum 1.125 Q1 Median Q3 4.000 5.250 6.000 7.000 Study 48 0 3.958 0.273 1.890 1.000 3.000 4.000 5.000 Cupscoffee 48 0 1.604 0.201 1.395 0.000 1.000 1.000 2.000 Gender 48 0 0.5000 0.0729 0.5053 0.0000 0.0000 0.5000 1.0000 Variable Maximum Sleep 9.000 Study 10.000 Cupscoffee 8.000 Gender 1.0000 PGA (2).xlsx IMG_4257.jpg P x & IMG_4258.jpg EN POFUS A 3C Clear ^ (8) 23:08 01.12.2022 PUS A8.p Com Com = Com Anti Final + Com Quiz ITBS NYU Albe M Inbc M (6e3 3an Cou | + 0 PDF Viewer chrome-extension://oemmndcbldboiebfnladdacbdfmadadm/https://brightspace.nyu.edu/d2l/common/viewFile.d2lfile/Database/... IMG_4261.jpg 4 7 Regression Analysis: Sleep versus Study, Cupscoffee, Gender The regression equation is Sleep = 6.19 + 0.238 Study - 0.341 Cupscoffee - 0.631 Gender Predictor Constant Coef 6.1916 SE Coef 0.3397 Study 0.23796 0.07155 Cupscoffee -0.34096 T 18.23 0.000 3.33 0.002 0.09791 -3.48 0.001 P Gender -0.6314 0.2678 -2.36 0.023 S = 0.912860 R-Sq = 38.4% R-Sq (adj) = 34.2% Analysis of Variance Source DF SS Regression 3 Residual Error 44 Total 47 22.8134 36.6658 59.4792 MS 7.6045 0.8333 F 9.13 P 0.000 PGA (2).xlsx IMG_4257.jpg IMG_4258.jpg P x EN 3C Clear ^ (8) POFUS A 23:08 01.12.2022 PUS A8.p Com Com = Com Anti Final + Com Quiz ITBS NYU * Albe M Inbc | M (6e3 Cou | + 0 IMG_4261.jpg PDF Viewer chrome-extension://oemmndcbldboiebfnladdacbdfmadadm/https://brightspace.nyu.edu/d2l/common/viewFile.d2lfile/Database/... 5 7 Problem 4 (13) A real estate broker estimated a multiple linear regression model for house prices (in $1000) in his area using as predictors: size of a house (in 100 sq ft), lotsize (in 1000 sq ft) and source of energy used to heat a house. There were three sources of energy: electricity, heating oil and natural gas. He coded this information as follows gas = oil = 1 if a house is heated by natural gas O if not 1 if a house is heated by heating oil = O if not The model was estimated using the data on 16 houses. a) There is an unusual observation in the regression of Price on all predic- tors (Model 1), see the graph of standardized residuals against fitted values. Describe what makes this observation unusual. How would this observation be denoted in the unusual observations part of the Minitab output? (3) b) An unusual observation was removed from the data and the regres- sion was rerun resulting in Model 2. How is Model 2 different from Model 12 What changed? PGA (2).xlsx Was removal of the unusual observation justified? IMG_4257.jpg P IMG_4258.jpg POFUS A EN 23:08 3C Clear ^ 01.12.2022 PUS A8.p Com Com = Com Anti Final + Com Quiz ITBS NYU Albe M Inbc M (6e3 Cou | + 0 POFUS A PDF Viewer chrome-extension://oemmndcbldboiebfnladdacbdfmadadm/https://brightspace.nyu.edu/d2l/common/viewFile.d2lfile/Database/... 5 7 tors (Model 1), see the graph of standardized residuals against fitted values. Describe what makes this observation unusual. How would this observation be denoted in the unusual observations part of the Minitab output? (3) b) An unusual observation was removed from the data and the regres- sion was rerun resulting in Model 2. How is Model 2 different from Model 1? What changed? Was a removal of the unusual observation justified? Explain. (2) c) Is the coefficient of Oil statistically significant in Model 2 at a = 0.01? (State and interpret the hypothesis test and state your conclusion). (3) d) Consider Model 3. Why was this model estimated? Interpret the coefficient of Oil in Model 3. (3) e) Based on Model 3, construct the 95% confidence interval for the mean price of 1900 sq feet houses with lotsizes of 6600 sq ft which are heated by Gas. The standard error of the fitted value (SEFit) for houses with these characteristics is 1.43.(3) f) Finally, consider Model 4 which was estimated based on the same data as Models 2-3, but uses different coding for Energy source: 1=heated by Oil, 2 heated by electricity, 3= heated by Gas. Interpret the coefficient of Energy source in this model. Which model do you prefer: Model 4 or Model 3? Justify your answer. (2) IMG_4261.jpg PGA (2).xlsx IMG_4257.jpg IMG_4258.jpg P x EN 3C Clear ^ (8) 23:08 01.12.2022 PUS A8.p Com Com = Com Anti Final + Com Quiz ITBS NYU Albe M Inbc M (6e3 3an Cou | + 0 PDF Viewer chrome-extension://oemmndcbldboiebfnladdacbdfmadadm/https://brightspace.nyu.edu/d2l/common/viewFile.d2lfile/Database/... IMG_4261.jpg 6 7 Regression Analysis: Price versus hsize, oil, gas, lotsize Model 1: Price = 100.9 + 1.229 hsize - 20.5 oil + 34.3 gas - 6.12 lotsize S 18.6181 R-sq 70.26% R-sq (adj) 59.44% Coefficients Term Constant hsize Coef 100.9 1.229 SE Coef T-Value P-Value 13.2 0.832 7.63 1.48 0.000 0.168 oil -20.5 11.6 -1.77 0.105 gas 34.3 13.5 2.53 0.028 lotsize -6.12 1.91 -3.21 0.008 lardized Residual 3 2 PGA (2).xlsx Versus Fits (response is Price IMG_4257.jpg IMG_4258.jpg P EN 3C Clear ^ (8) POFUS A 23:08 01.12.2022 PUS A8.p Com Com = Com Anti Final + Com Quiz ITBS NYU Albe M Inbc M (6e3 3an Cou | + 0 PDF Viewer chrome-extension://oemmndcbldboiebfnladdacbdfmadadm/https://brightspace.nyu.edu/d2l/common/viewFile.d2lfile/Database/... IMG_4261.jpg 6 7 ^ Standardized Residual 3 Versus Fits (response is Price 20 40 60 80 100 120 Fitted Value After an unusual observation was removed: Model 2 Price = -3.06 + 2.66 gas + 3.219 lotsize +4.046 hsize - 10.68 oil S 4.48337 R-sq 96.77% R-sq (adj) 95.48% Coefficients PGA (2).xlsx IMG_4257.jpg IMG_4258.jpg P x EN 3C Clear ^ (8) POFUS A 23:08 01.12.2022 PUS A8.p Com Com = Com Anti Final + Com Quiz ITBS NYU Albe M Inbc M (6e3 3an Cou | + 0 PDF Viewer chrome-extension://oemmndcbldboiebfnladdacbdfmadadm/https://brightspace.nyu.edu/d2l/common/viewFile.d2lfile/Database/... IMG_4261.jpg 7 7 Model 3: Price = -5.33 +4.087 hsize - 11.13 oil + 3.609 lotsize S R-sq 4.36688 96.63% Coefficients Term Constant -5.33 R-sq (adj) 95.71% Coef SE Coef T-Value P-Value 7.45 -0.72 0.489 hsize 4.087 0.276 14.80 0.000 oil -11.13 2.73 -4.07 0.002 lotsize 3.609 0.573 6.30 0.000 Model 4: Price = -17.02 +4.010 hsize + 2.683 lotsize + 7.72 Energy source Model Summary S 4.71156 R-sq 96.08% R-sq (adj) 95.01% Coefficients Term Constant -17.02 hsize 4.010 lotsize 2.683 Energy source Coef SE Coef T-Value P-Value 7.05 -2.42 0.034 0.304 13.19 0.000 0.788 3.40 0.006 7.72 2.17 3.56 0.004 ^ PGA (2).xlsx P IMG_4257.jpg IMG_4258.jpg EN 3C Clear ^ (8) POFUS A 23:08 01.12.2022 PUS A8.p Com Com = Com Anti Final + Com Quiz ITBS NYU Albe M Inbc M (6e3 3an Cou | + PDF Viewer chrome-extension://oemmndcbldboiebfnladdacbdfmadadm/https://brightspace.nyu.edu/d2l/common/viewFile.d2lfile/Database/... IMG_4261.jpg 1 7 + Problem 1 (Default rate) (6) Questions below refer to Problem 3 in Assignment 8. a) Obtain and interpret a 95% confidence for the mean default rate of financial institutions which charge interest rate of 7% on their loans using SEFit (7%)=0.805. Is this a valid confidence interval?(2) b) Obtain and interpret a 95% prediction interval for default rate of financial institution, which charges interest rate of 7%. (3) c) Suppose that the roles of response and predictor variables were inter- changed, that is, the response variable is now Interest rate and predictor is the Default rate. What is the r of this new regression? (Explain) (1) Problem 2 (15) A survey of a random sample of 48 NYU students was conducted to investigate the relationship between Sleep-average sleep time per night (in hours) and the following variables: Study average study time per day (in hours) Coffee Cups average number of cups of coffee consumed by a student per day, and Extra = average number of extra-curricular activities per day Age (in years) Female(1 female, 0=male) PGA (2).xlsx IMG_4257.jpg P IMG_4258.jpg EN 3C Clear ^ POFUS A (8) ... 23:07 01.12.2022 PUS A8.p Com Com = Com Anti Final + Com Quiz ITBS NYU Albe M Inbc M (6e3 3an Cou | + PDF Viewer chrome-extension://oemmndcbldboiebfnladdacbdfmadadm/https://brightspace.nyu.edu/d2l/common/viewFile.d2lfile/Database/... IMG_4261.jpg 1 7 + Coffee Cups =average number of cups of coffee consumed by a student per day, and Extra = average number of extra-curricular activities per day Age (in years) Female (1=female, 0=male) In the first part of their analysis the students were interested in how Sleep depends on gender. a) Write down the estimated regression model of Sleep on Female know- ing that for females the sample mean of Sleep is 5.912 hours and for males the sample mean of Sleep is 6.62 hours. (3) b) Is the regression of Sleep on Female statistically significant at a = 0.05? (State the hypothesis test, interpret Ho and H and state your con- clusion.) (2) c) What is the r of the regression of Sleep on Female? (2) PGA (2).xlsx 1 IMG_4257.jpg IMG_4258.jpg P x EN 3C Clear ^ POFUS A (8) ... 23:07 01.12.2022
Step by Step Solution
There are 3 Steps involved in it

Get step-by-step solutions from verified subject matter experts