

Question: P-Value = 0.011 IT V T Insert Table Chart Text Shape Media Comment Test and CI for Two Proportions: Smoke, Gender Method Event: Smoke =
P-Value = 0.011
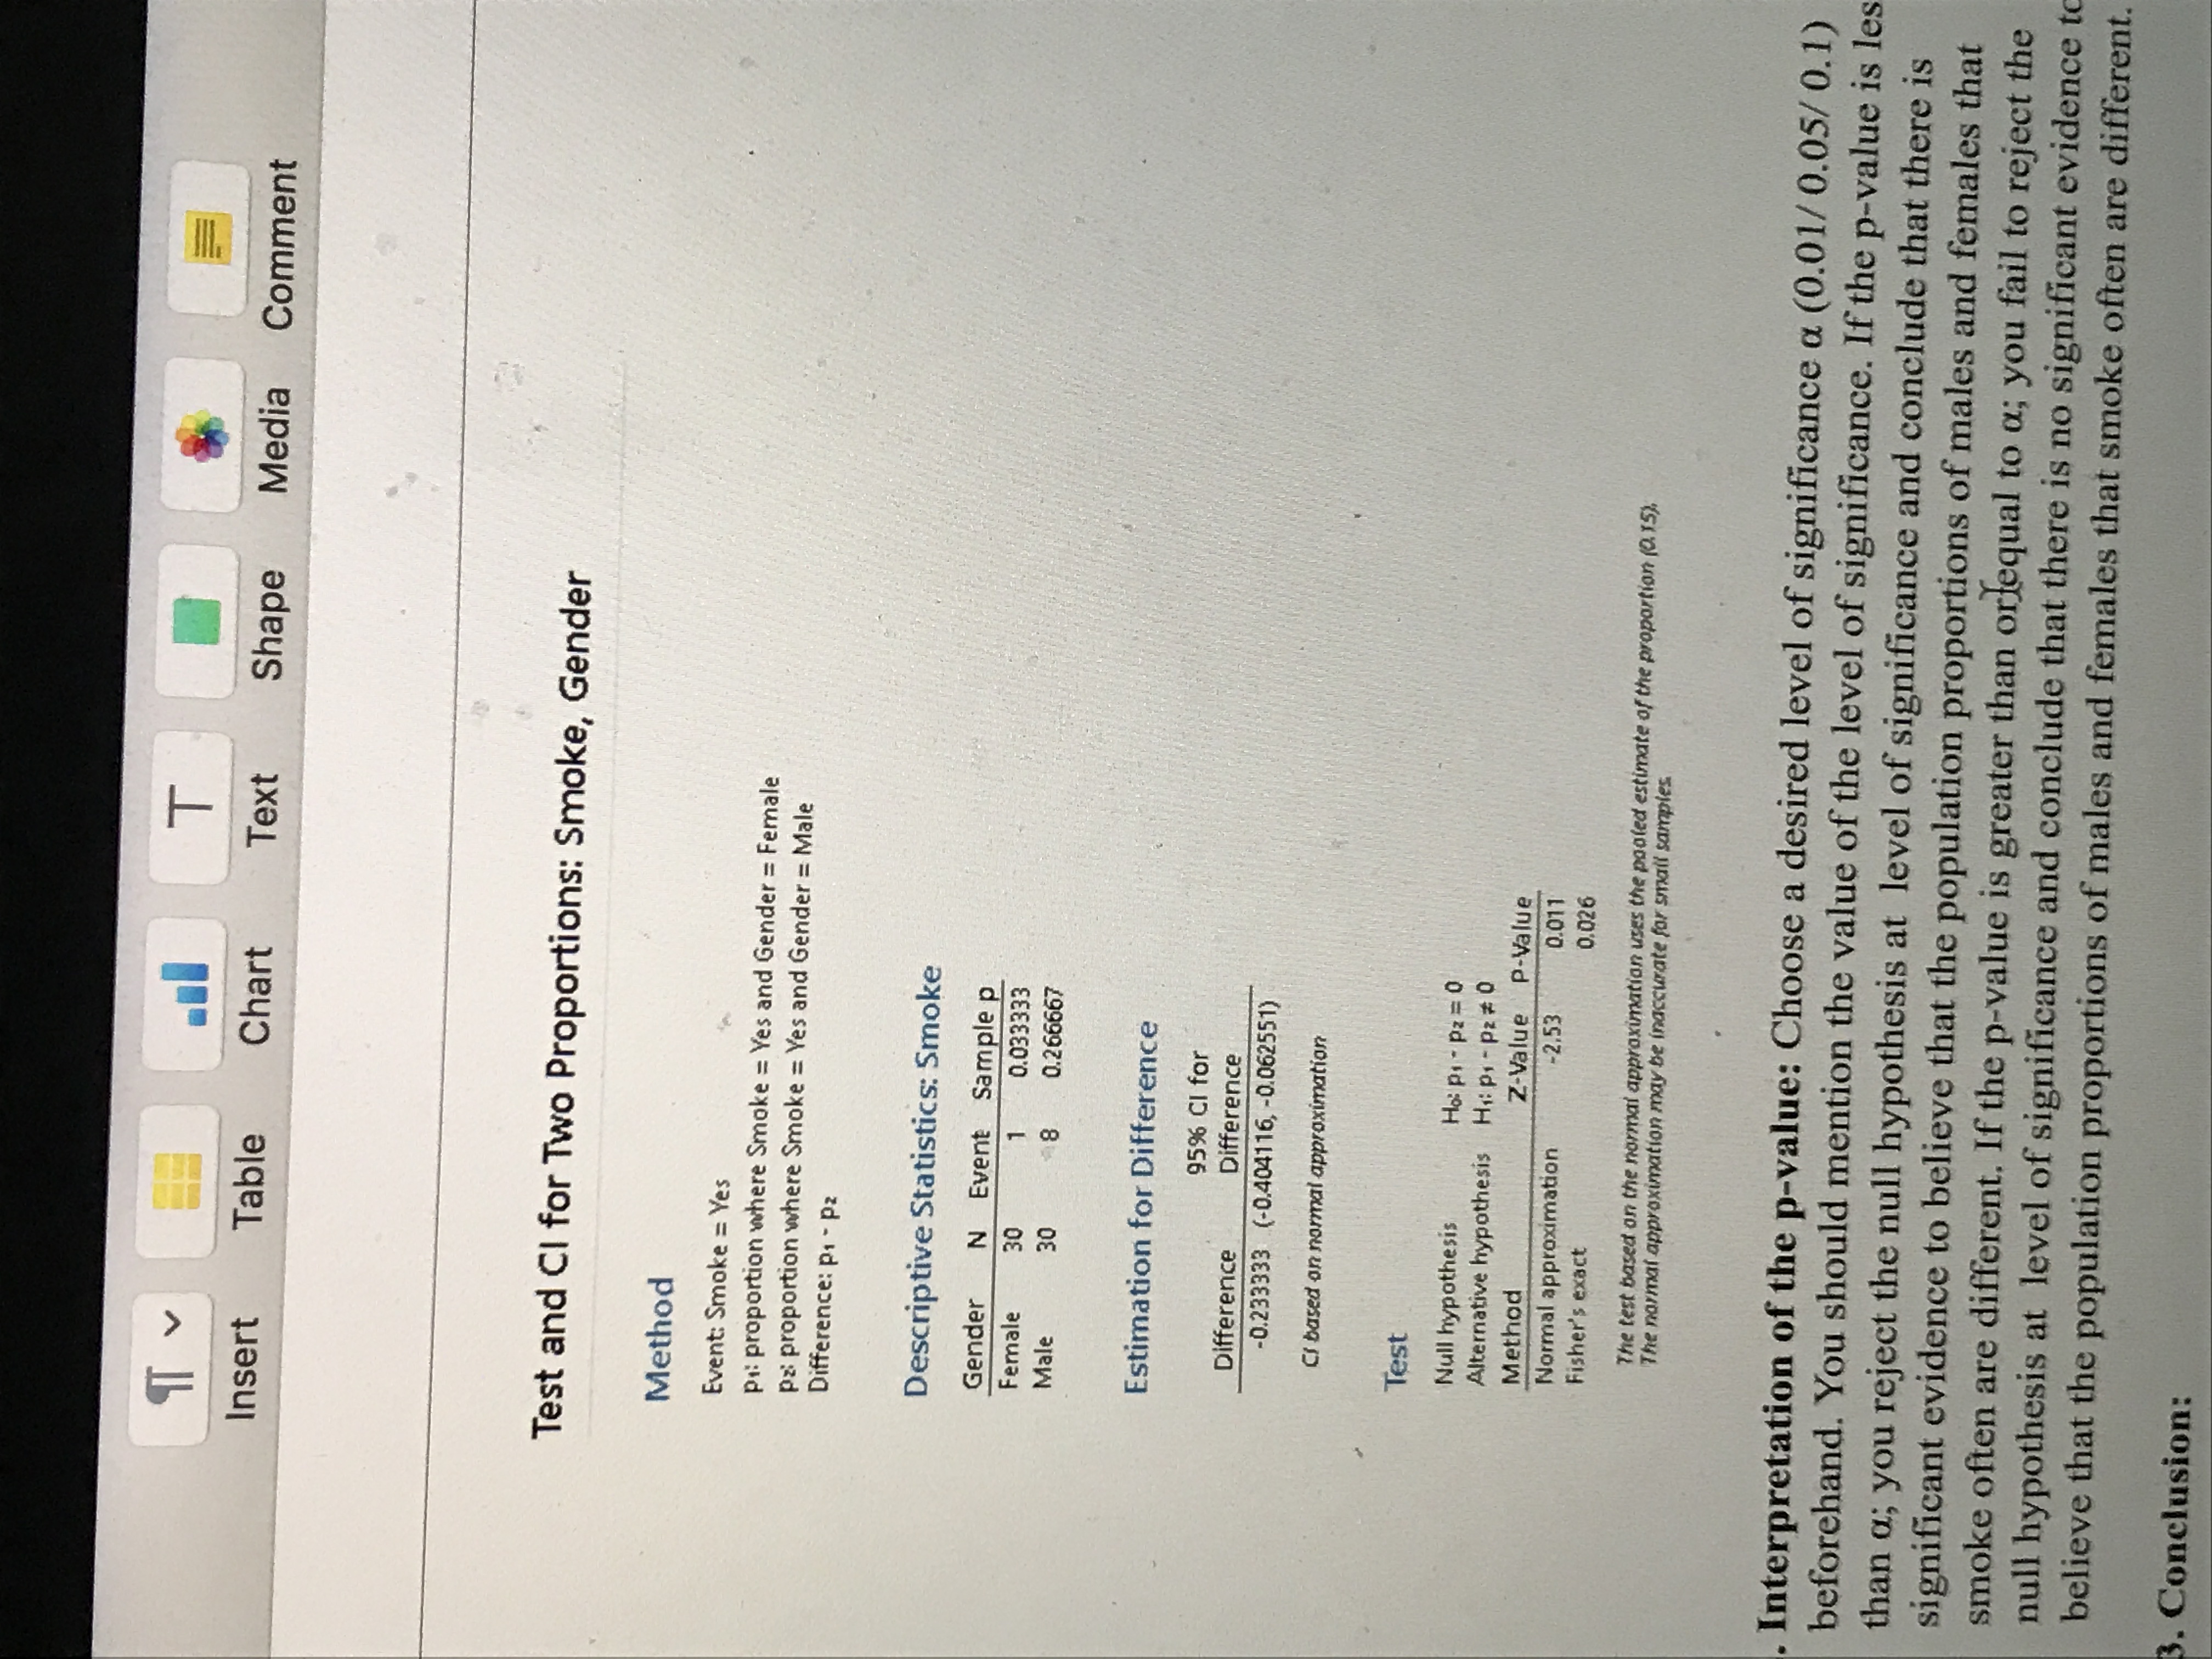
IT V T Insert Table Chart Text Shape Media Comment Test and CI for Two Proportions: Smoke, Gender Method Event: Smoke = Yes p1: proportion where Smoke = Yes and Gender = Female pz: proportion where Smoke = Yes and Gender = Male Difference: p1 - pz Descriptive Statistics: Smoke Gender N Event Sample p Female 30 0.033333 Male 30 8 0.266667 Estimation for Difference 95% CI for Difference Difference -0.233333 (-0.404116, -0.062551) Ci based on normal approximation Test Null hypothesis Ho: P1 - pz = 0 Alternative hypothesis H,: p, - pz # 0 Method Z-Value P-Value Normal approximation -2.53 0.011 Fisher's exact 0.026 The test based on the normal approximation uses the pooled estimate of the proportion (0.15), The normal approximation may be inaccurate for small samples Interpretation of the p-value: Choose a desired level of significance a (0.01/ 0.05/ 0.1) beforehand. You should mention the value of the level of significance. If the p-value is les than a; you reject the null hypothesis at level of significance and conclude that there is significant evidence to believe that the population proportions of males and females that smoke often are different. If the p-value is greater than orfequal to a; you fail to reject the null hypothesis at level of significance and conclude that there is no significant evidence to believe that the population proportions of males and females that smoke often are different. 3. Conclusion
Step by Step Solution
There are 3 Steps involved in it

Get step-by-step solutions from verified subject matter experts