

Question: p-value If p-value> alpha : Fail to reject the null which means accept the Ho Select One variable X's from the Regression Analysis of Data
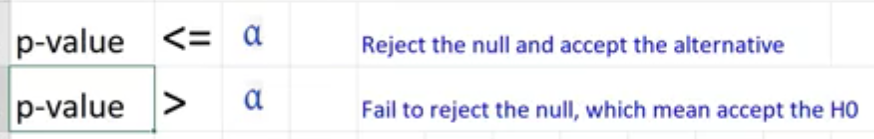
p-value
If p-value> alpha : Fail to reject the null which means accept the Ho
Select One variable X's from the Regression Analysis of Data Set 2 and discuss the p-value
Discuss the finding of p-value of Hypothesis Testing of Education variable. What is your advise or recommendation to the single mothers?
| Volume per day | Cost per day |
| 23 | 125 |
| 26 | 140 |
| 29 | 146 |
| 33 | 160 |
| 38 | 167 |
| 42 | 170 |
| 50 | 188 |
| 55 | 195 |
| 60 | 200 |
Step by Step Solution
There are 3 Steps involved in it
1 Expert Approved Answer
Step: 1 Unlock

Question Has Been Solved by an Expert!
Get step-by-step solutions from verified subject matter experts
Step: 2 Unlock
Step: 3 Unlock