

Question: PVT data are sometimes plotted using the log - scale along one axis such as for the figure for ammonia in the next page. (
PVT data are sometimes plotted using the logscale along one axis such as for the figure for ammonia in the next page.
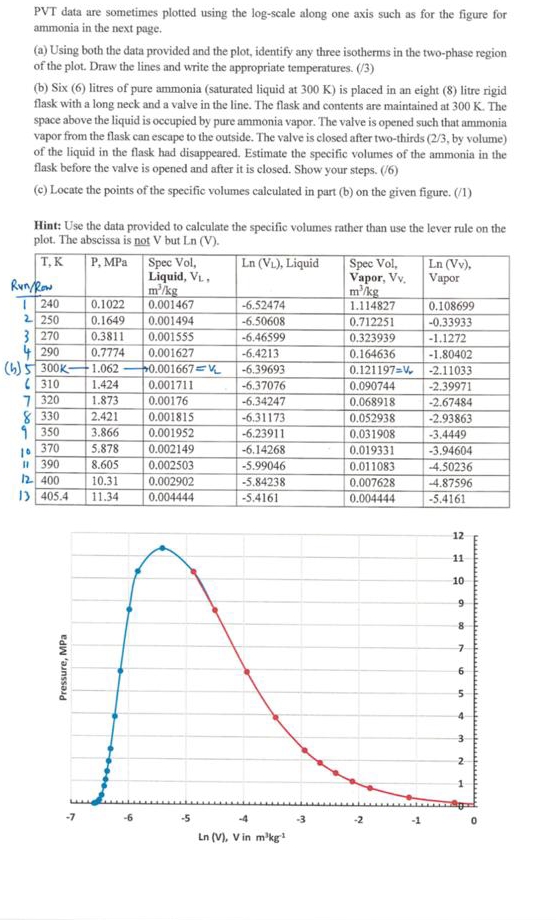
a Using both the data provided and the plot, identify any three isotherms in the twophase region of the plot. Draw the lines and write the appropriate temperatures.
b Six litres of pure ammonia saturated liquid at is placed in an eight litre rigid flask with a long neck and a valve in the line. The flask and contents are maintained at The space above the liquid is occupied by pure ammonia vapor. The valve is opened such that ammonia vapor from the flask can escape to the outside. The valve is closed after twothirds by volume of the liquid in the flask had disappeared. Estimate the specific volumes of the ammonia in the flask before the valve is opened and after it is closed. Show your steps.
c Locate the points of the specific volumes calculated in part b on the given figure.
Hint: Use the data provided to calculate the specific volumes rather than use the lever rule on the plot. The abscissa is not but
tabletableT KRowMPa,tableSpec Vol,Liquid
Step by Step Solution
There are 3 Steps involved in it
1 Expert Approved Answer
Step: 1 Unlock

Question Has Been Solved by an Expert!
Get step-by-step solutions from verified subject matter experts
Step: 2 Unlock
Step: 3 Unlock