

Question: python code for all the commented steps please thank you! Can you observe the different correlation trends in above visualization? To see how each of
python code for all the commented steps please thank you!
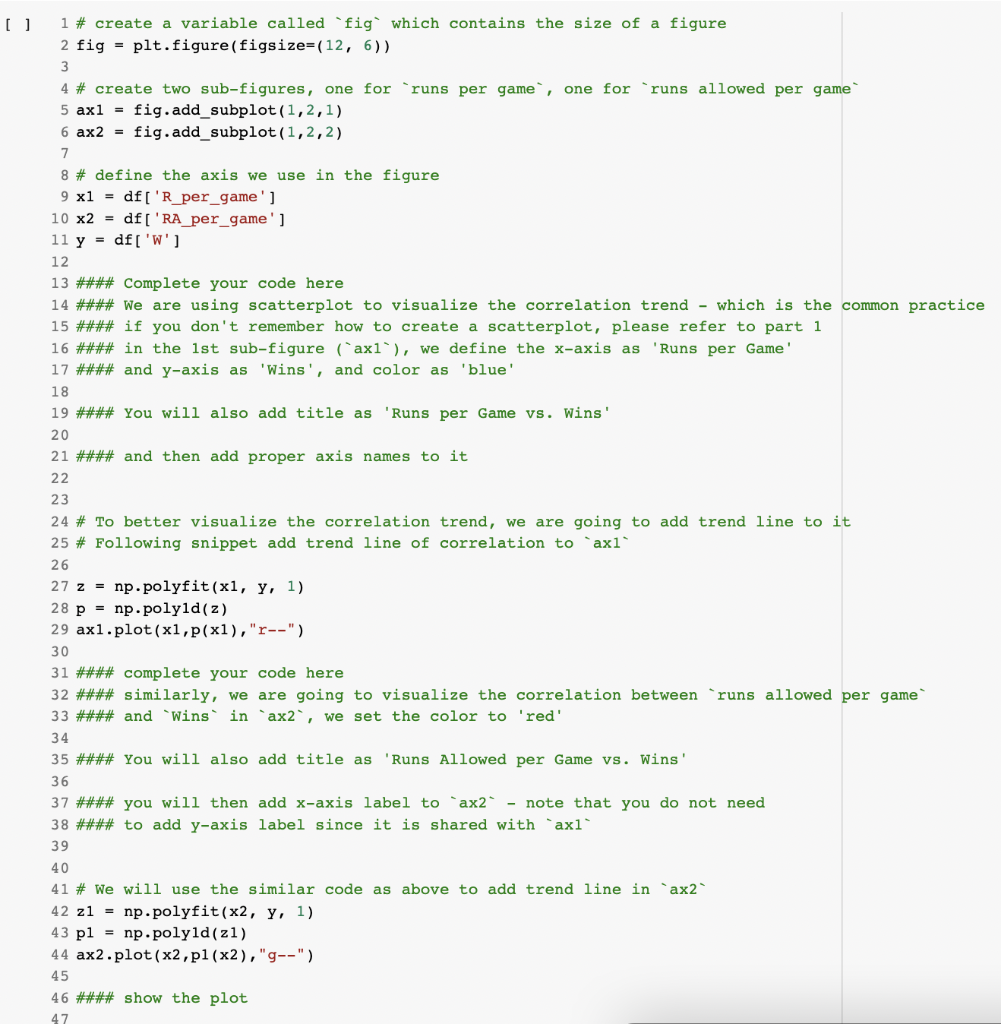
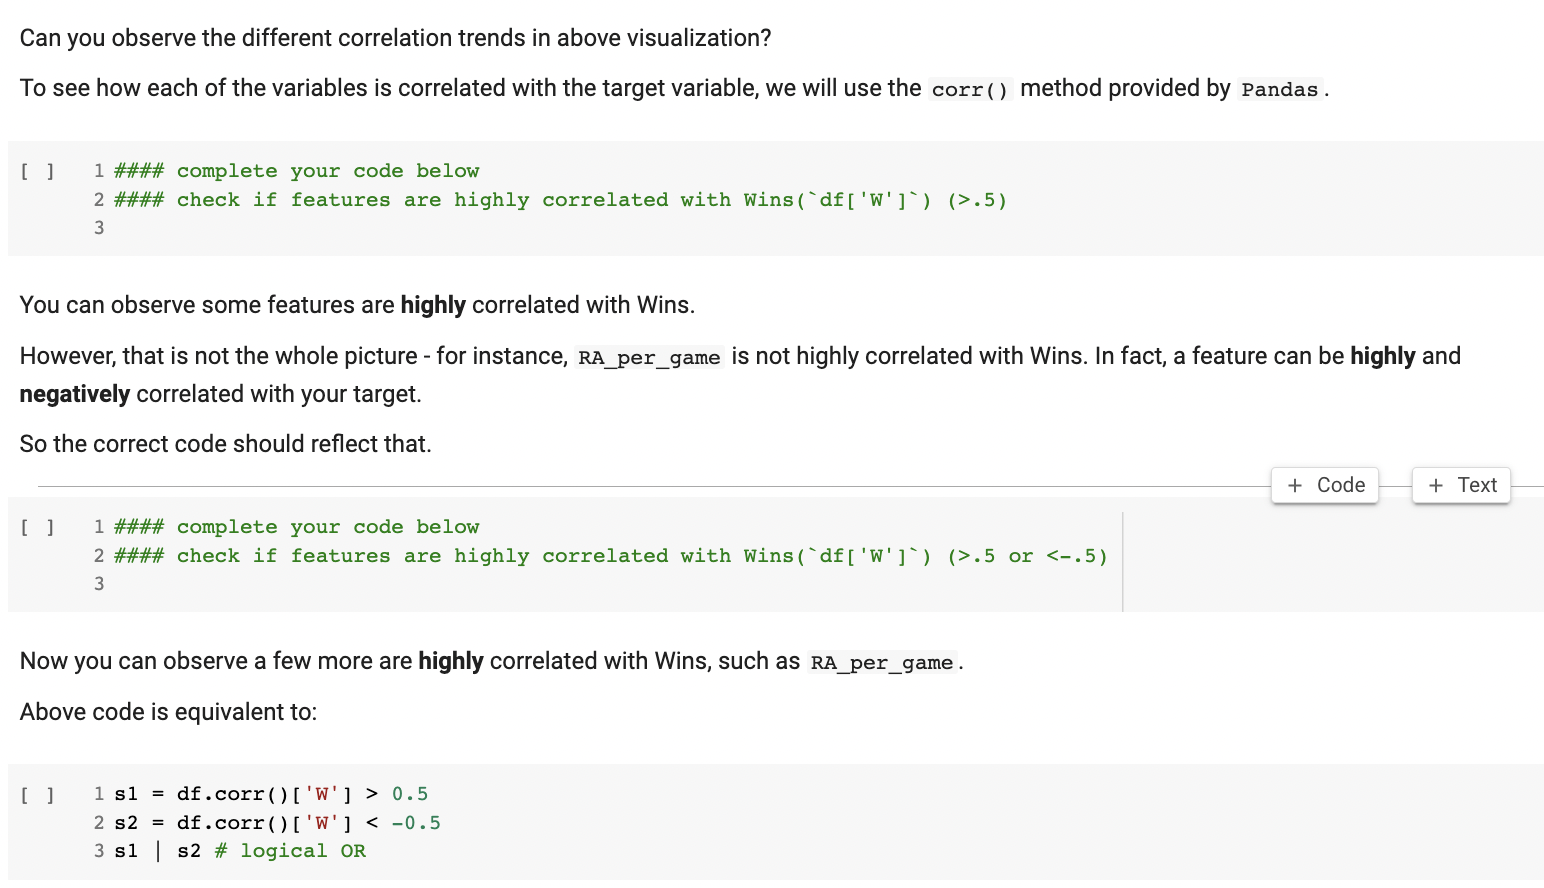
Can you observe the different correlation trends in above visualization? To see how each of the variables is correlated with the target variable, we will use the corr () method provided by Pandas . [ ] 1 \#\#\#\# complete your code below 2 \#\#\#\# check if features are highly correlated with Wins('df['W']') (>.5) You can observe some features are highly correlated with Wins. However, that is not the whole picture - for instance, RA_per_game is not highly correlated with Wins. In fact, a feature can be highly and negatively correlated with your target. So the correct code should reflect that. [ ] 1 \#\#\#\# complete your code below 2 \#\#\#\# check if features are highly correlated with Wins('df[' W ' ]' ) (>.5 or <.5 now you can observe a few more are highly correlated with wins such as ra_per_game . above code is equivalent to>
Step by Step Solution
There are 3 Steps involved in it

Get step-by-step solutions from verified subject matter experts