

Question: python code for commented steps please More on Data Visualization Clearly, rpg_df is time series data - and in which the most important feature would
python code for commented steps please
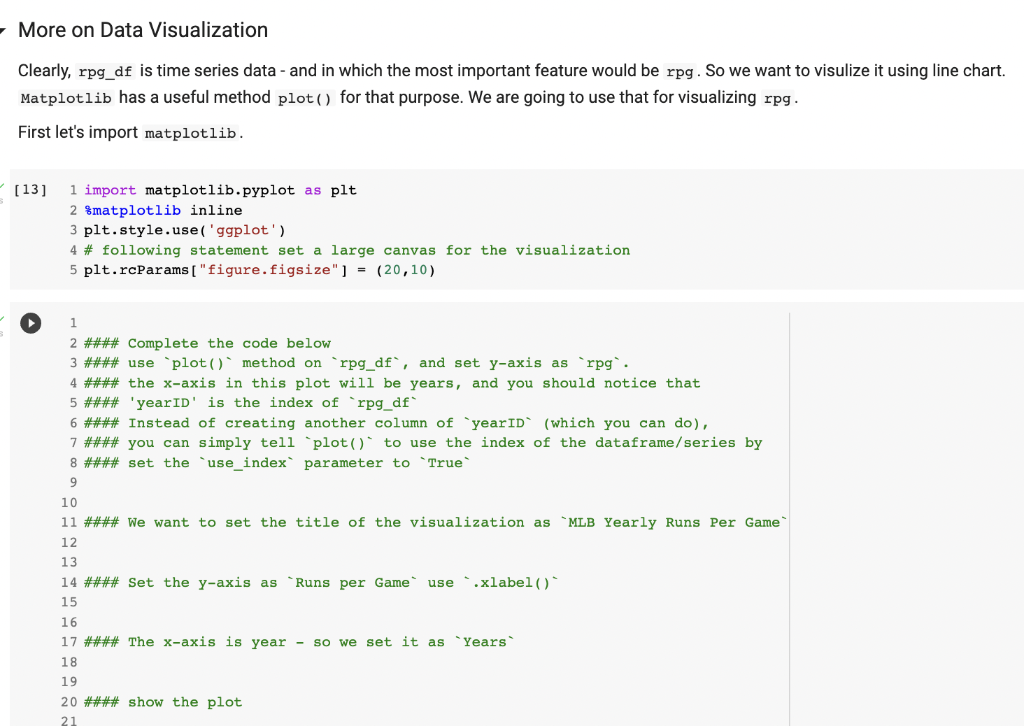
More on Data Visualization Clearly, rpg_df is time series data - and in which the most important feature would be rpg . So we want to visulize it using line chart. Matplotlib has a useful method plot () for that purpose. We are going to use that for visualizing rpg . First let's import matplotlib. [13] 1 import matplotlib.pyplot as plt 2 matplotlib inline 3 plt. style.use('ggplot') 4 \# following statement set a large canvas for the visualization 5 plt.raparams[ figure.figsize"] =(20,10) 1 2 \#\#\#\# Complete the code below 3 \#\#\#\# use "plot () method on "rpg_df', and set y-axis as "rpg'. 4 \#\#\#\# the x-axis in this plot will be years, and you should notice that 5 \#\#\#\# 'yearID' is the index of 'rpg_df' 6 \#\#\#\# Instead of creating another column of "yearID' (which you can do), 7 \#\#\#\# you can simply tell 'plot()' to use the index of the dataframe/series by 8 \#\#\#\# set the 'use_index' parameter to "True' 9 10 11 \#\#\#\# We want to set the title of the visualization as 'MLB Yearly Runs Per Game' 12 13 14 \#\#\#\# Set the y-axis as 'Runs per Game' use '.xlabel()" 15 \#\#\#\# The x-axis is year - so we set it as "Years" \#\#\# show the plot
Step by Step Solution
There are 3 Steps involved in it

Get step-by-step solutions from verified subject matter experts