

Question: PYTHON CODE ONLY Problem 4 - Pandas and Matplotlib ( 38 pts): Airplane crashes An Excel worksheet file of airplane crashes is available in the

PYTHON CODE ONLY
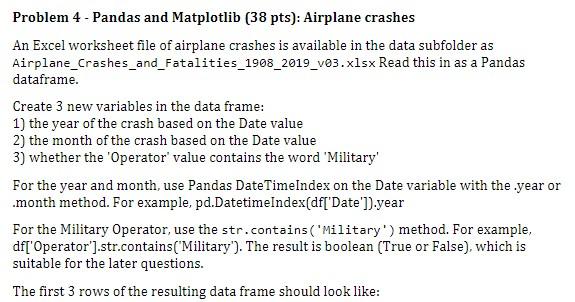
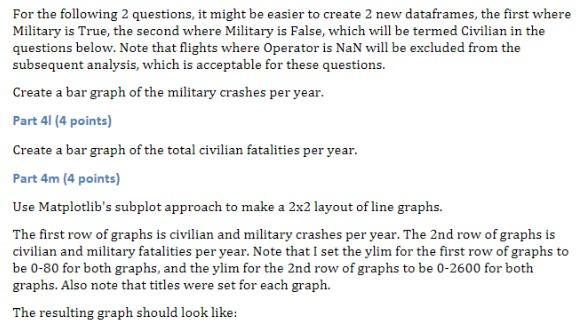
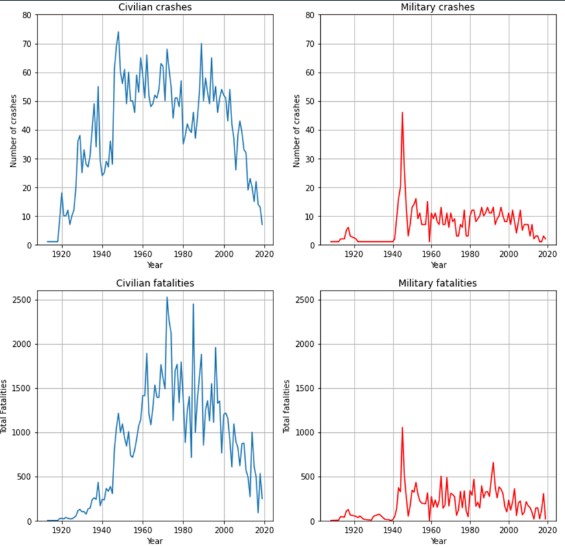
Problem 4 - Pandas and Matplotlib ( 38 pts): Airplane crashes An Excel worksheet file of airplane crashes is available in the data subfolder as Airplane_Crashes_and_Fatalities_1908_2019_v03.xlsx Read this in as a Pandas dataframe. Create 3 new variables in the data frame: 1) the year of the crash based on the Date value 2) the month of the crash based on the Date value 3) whether the 'Operator' value contains the word 'Military' For the year and month, use Pandas DateTimeIndex on the Date variable with the year or .month method. For example, pd.DatetimeIndex(df['Date']).year For the Military Operator, use the str. contains ('Military') method. For example, df['Operator'].str.contains('Military'). The result is boolean (True or False), which is suitable for the later questions. The first 3 rows of the resulting data frame should look like: == How many total crashes were reported? Part 4b ( 2 points) How many Operator values are missing, i.e. read in as NaN? Part 4 ( 2 points) How many Fatalities values are missing, i.e. read in as NaN? Part 4d ( 2 points) How many military crashes were reported? What is the mean number of fatalities per crash? Part 4f ( 3 points) What percent of crashes had ground fatalities? (You will have to calculate this yourself. There is not a Python method to do all the work directly.) Part 4g ( 3 points) What year had the highest number of crashes? Hint: the Date variable has no missing entries, so a groupby count on Year, followed by finding the Date result with the highest value. Part 4h ( 3 points) What year had the highest number of total fatalities? Part 4i ( 3 points) What month of year from 1980 through 2018 inclusive had the highest mean number of fatalities? Part 4j (4 points) Create a bar plot of the number of crashes per year. (Minor hint: you can check your answer to 4h here.) For the following 2 questions, it might be easier to create 2 new dataframes, the first where Military is True, the second where Military is False, which will be termed Civilian in the questions below. Note that flights where Operator is NaN will be excluded from the subsequent analysis, which is acceptable for these questions. Create a bar graph of the military crashes per year. Part 41 (4 points) Create a bar graph of the total civilian fatalities per year. Part 4m (4 points) Use Matplotlib's subplot approach to make a 22 layout of line graphs. The first row of graphs is civilian and military crashes per year. The 2 nd row of graphs is civilian and military fatalities per year. Note that I set the ylim for the first row of graphs to be 0-80 for both graphs, and the ylim for the 2 nd row of graphs to be 02600 for both graphs. Also note that titles were set for each graph. The resulting graph should look like
Step by Step Solution
There are 3 Steps involved in it

Get step-by-step solutions from verified subject matter experts