

Question: PYTHON CODE problem: tracing images from scipy import misc import numpy as np import matplotlib.pyplot as plt Open up an image editor (e.g. MS Paint,
PYTHON CODE problem: tracing images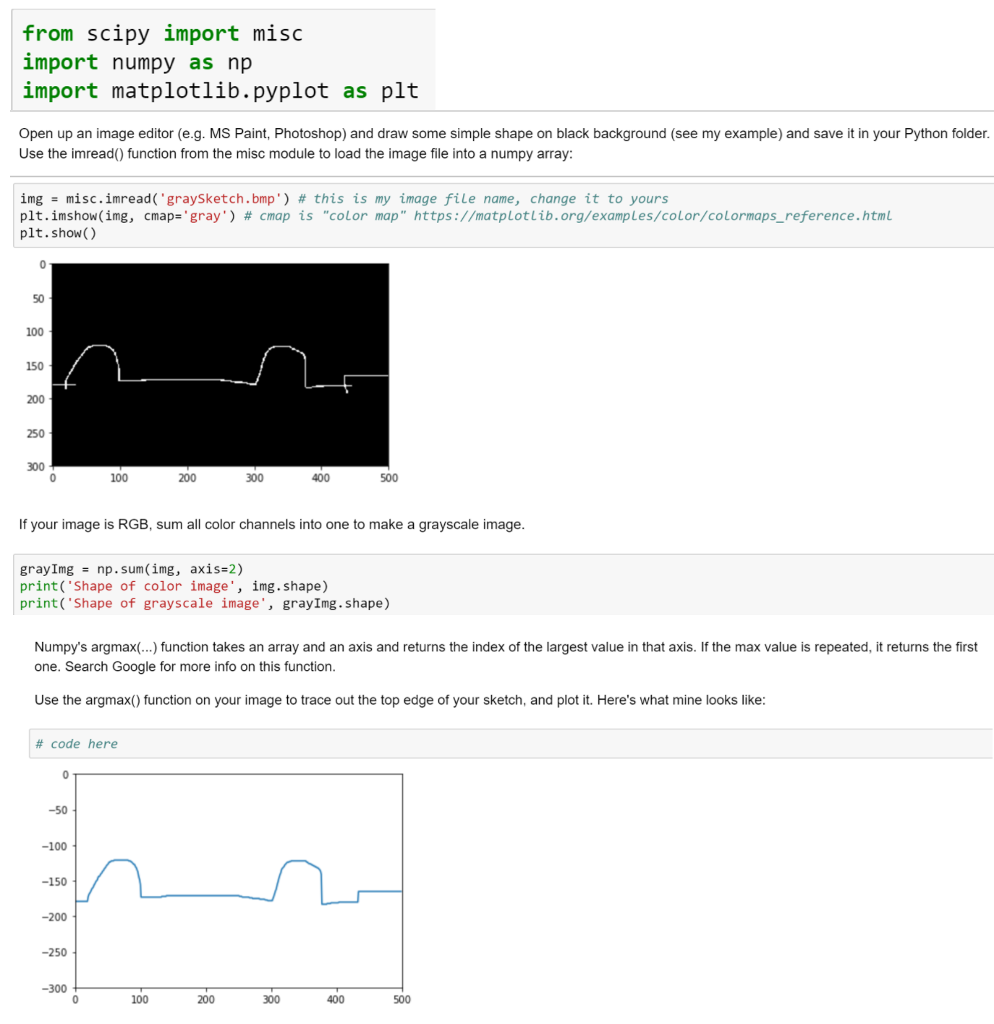
from scipy import misc import numpy as np import matplotlib.pyplot as plt Open up an image editor (e.g. MS Paint, Photoshop) and draw some simple shape on black background (see my example) and save it in your Python folder Use the imread) function from the misc module to load the image file into a numpy array: img -misc.inread(.graySketch.bmp') # this is my image file name, change it to yours pit.inshon(ing, cmape gray') # cmap is "color map.. https://matplotlib. org/examples/color/colormaps-reference.htmL plt.show() 100 150 250 300 100 300 500 If your image is RGB, sum all color channels into one to make a grayscale image gray 1mg np . sum(img, axis-2) print( Shape of color image', img.shape) print( Shape of grayscale image', grayImg. shape) Numpy's argmax() function takes an array and an axis and returns the index of the largest value in that axis. If the max value is repeated, it returns the first one. Search Google for more info on this function. Use the argmax) function on your image to trace out the top edge of your sketch, and plot it. Here's what mine looks like # code here -100 -150 -250 -300 100 300 500 from scipy import misc import numpy as np import matplotlib.pyplot as plt Open up an image editor (e.g. MS Paint, Photoshop) and draw some simple shape on black background (see my example) and save it in your Python folder Use the imread) function from the misc module to load the image file into a numpy array: img -misc.inread(.graySketch.bmp') # this is my image file name, change it to yours pit.inshon(ing, cmape gray') # cmap is "color map.. https://matplotlib. org/examples/color/colormaps-reference.htmL plt.show() 100 150 250 300 100 300 500 If your image is RGB, sum all color channels into one to make a grayscale image gray 1mg np . sum(img, axis-2) print( Shape of color image', img.shape) print( Shape of grayscale image', grayImg. shape) Numpy's argmax() function takes an array and an axis and returns the index of the largest value in that axis. If the max value is repeated, it returns the first one. Search Google for more info on this function. Use the argmax) function on your image to trace out the top edge of your sketch, and plot it. Here's what mine looks like # code here -100 -150 -250 -300 100 300 500
Step by Step Solution
There are 3 Steps involved in it

Get step-by-step solutions from verified subject matter experts