

Question: Python Create one figure with two subplots; one subplot of the interpolant p 10 (0) alongside () using 100 evaluation points, [1,1], and another subplot
Python
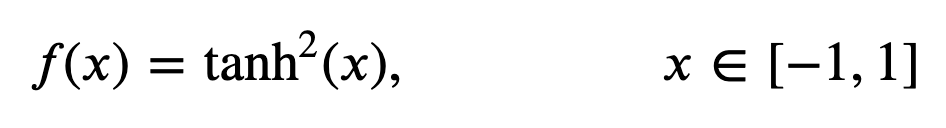
Create one figure with two subplots; one subplot of the interpolant p10(0) alongside () using 100 evaluation points, [1,1], and another subplot of the error, |()10()| in this approximation. Label your figure appropriately.
f(x)=tanh2(x)
Step by Step Solution
There are 3 Steps involved in it
1 Expert Approved Answer
Step: 1 Unlock

Question Has Been Solved by an Expert!
Get step-by-step solutions from verified subject matter experts
Step: 2 Unlock
Step: 3 Unlock