

Question: Python exercise The plot below shows some temperature data with an increase over time, but the author clearly hasn't thought about how best to show
Python exercise
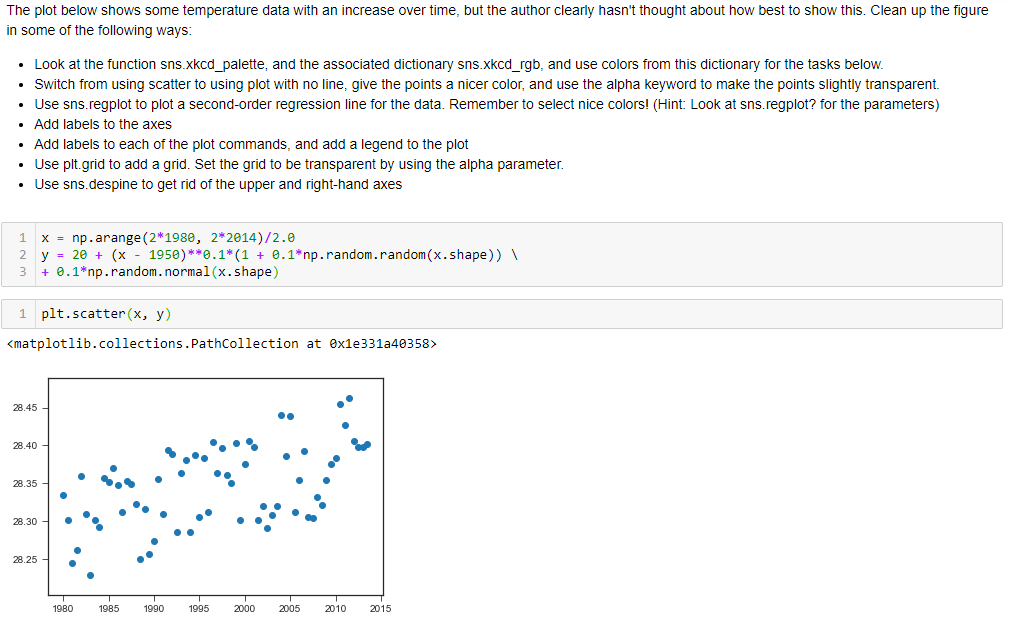
The plot below shows some temperature data with an increase over time, but the author clearly hasn't thought about how best to show this. Clean up the figure in some of the following ways . Look at the function sns.xkcd_palette, and the associated dictionary sns.xkcd_rgb, and use colors from this dictionary for the tasks below. Switch from using scatter to using plot with no line, give the points a nicer color, and use the alpha keyword to make the points slightly transparent. . Use sns.regplot to plot a second-order regression line for the data. Remember to select nice colors! (Hint: Look at sns.regplot? for the parameters) Add labels to the axes . Add labels to each of the plot commands, and add a legend to the plot . Use plt.grid to add a grid. Set the grid to be transparent by using the alpha parameter. . Use sns.despine to get rid of the upper and right-hand axes 1 xnp.arange (2*1980, 2 2014)/2.0 2 y 20 + (x - 1950)**0.1*(1 + 0.1"np. random . random(xshape)) 3 0.1 np.random.normal(x.shape) \ 1 plt.scatter(x, y)
Step by Step Solution
There are 3 Steps involved in it

Get step-by-step solutions from verified subject matter experts