

Question: Python help Use Scipy.optimize.curve_fit to fit the xy data below with a linear and a cubic model. Be sure to plot the results as shown
Python help 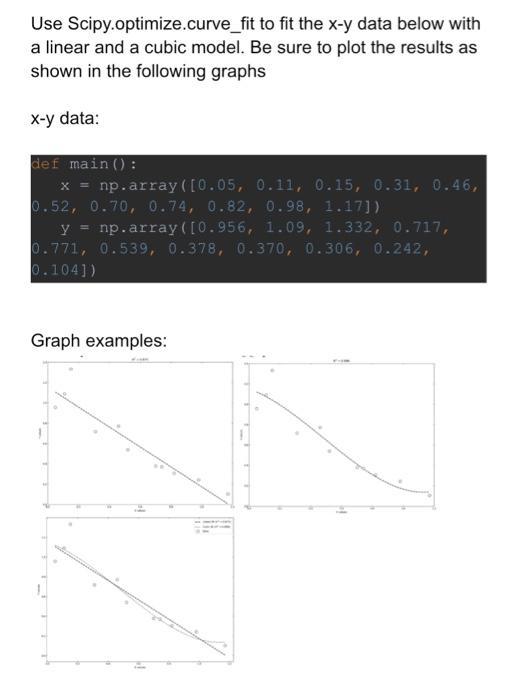
Use Scipy.optimize.curve_fit to fit the xy data below with a linear and a cubic model. Be sure to plot the results as shown in the following graphs x-y data: def main(): x= np.array ([0.05,0.11,0.15,0.31,0.46, 0.52,0.70,0.74,0.82,0.98,1.17]) y= np.array ([0.956,1.09,1.332,0.717 0.771,0.539,0.378,0.370,0.306,0.242 0.104]) Graph examples
Step by Step Solution
There are 3 Steps involved in it
1 Expert Approved Answer
Step: 1 Unlock

Question Has Been Solved by an Expert!
Get step-by-step solutions from verified subject matter experts
Step: 2 Unlock
Step: 3 Unlock