

Question: python language question. pls provide copied codes or screenshots of answers, instead of a handwritten answer. thank you in advance! counts_5a.txt is partially provided: year,month,day,week_of_year,day_of_week,day_of_year,site_id,weight_class,count
python language question.
pls provide copied codes or screenshots of answers, instead of a handwritten answer. thank you in advance!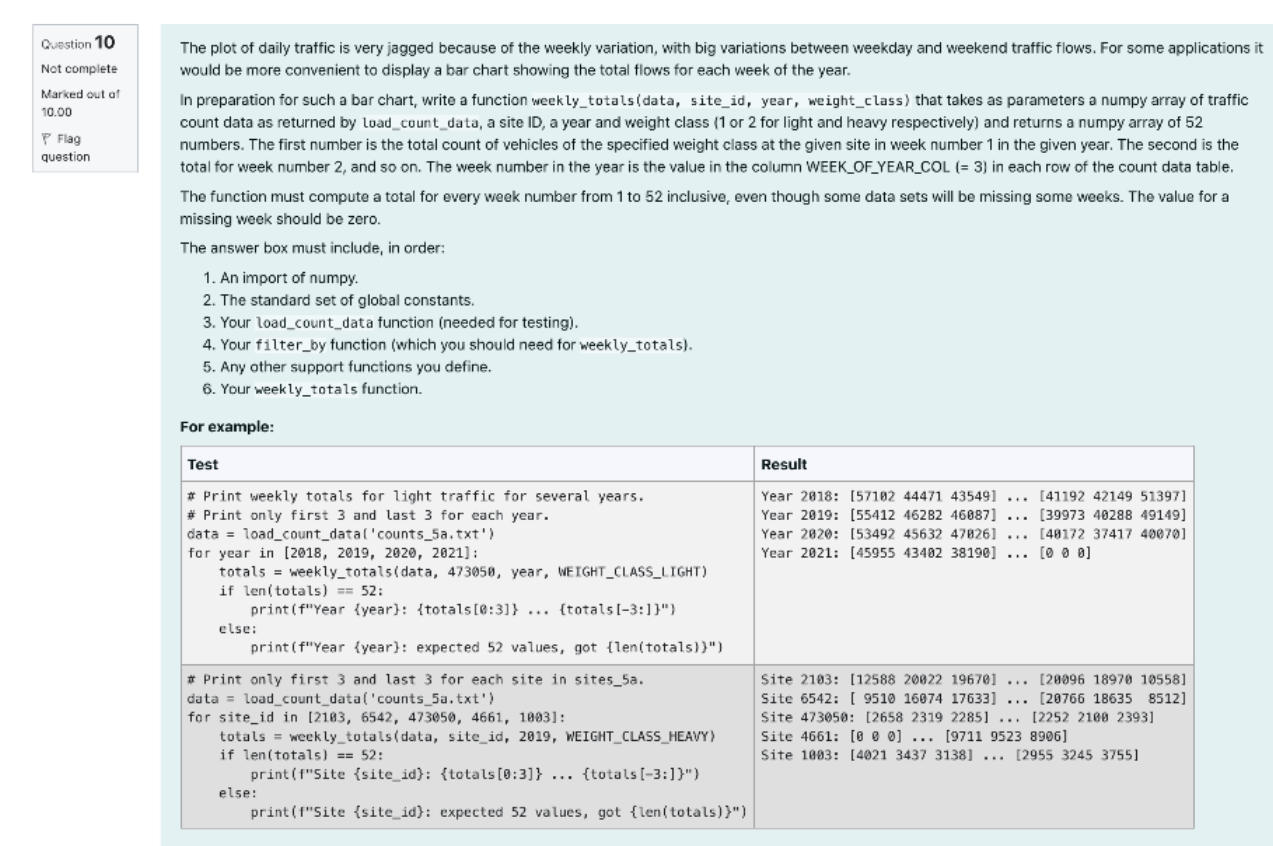
counts_5a.txt is partially provided:
year,month,day,week_of_year,day_of_week,day_of_year,site_id,weight_class,count 2018,1,1,1,1,1,2103,1,29198 2018,1,1,1,1,1,2103,2,769 2018,1,1,1,1,1,6542,1,26862 2018,1,1,1,1,1,6542,2,462 2018,1,1,1,1,1,473050,2,409 2018,1,1,1,1,1,473050,1,9366 2018,1,2,1,2,2,2103,2,1108 2018,1,2,1,2,2,2103,1,30205 2018,1,2,1,2,2,4661,2,1525 2018,1,2,1,2,2,4661,1,26155 2018,1,2,1,2,2,6542,2,677 2018,1,2,1,2,2,6542,1,27042 2018,1,2,1,2,2,473050,2,520 2018,1,2,1,2,2,473050,1,10050 2018,1,3,1,3,3,1003,1,8551 2018,1,3,1,3,3,1003,2,709 2018,1,3,1,3,3,2103,1,37015 2018,1,3,1,3,3,2103,2,2319 2018,1,3,1,3,3,4661,1,28315
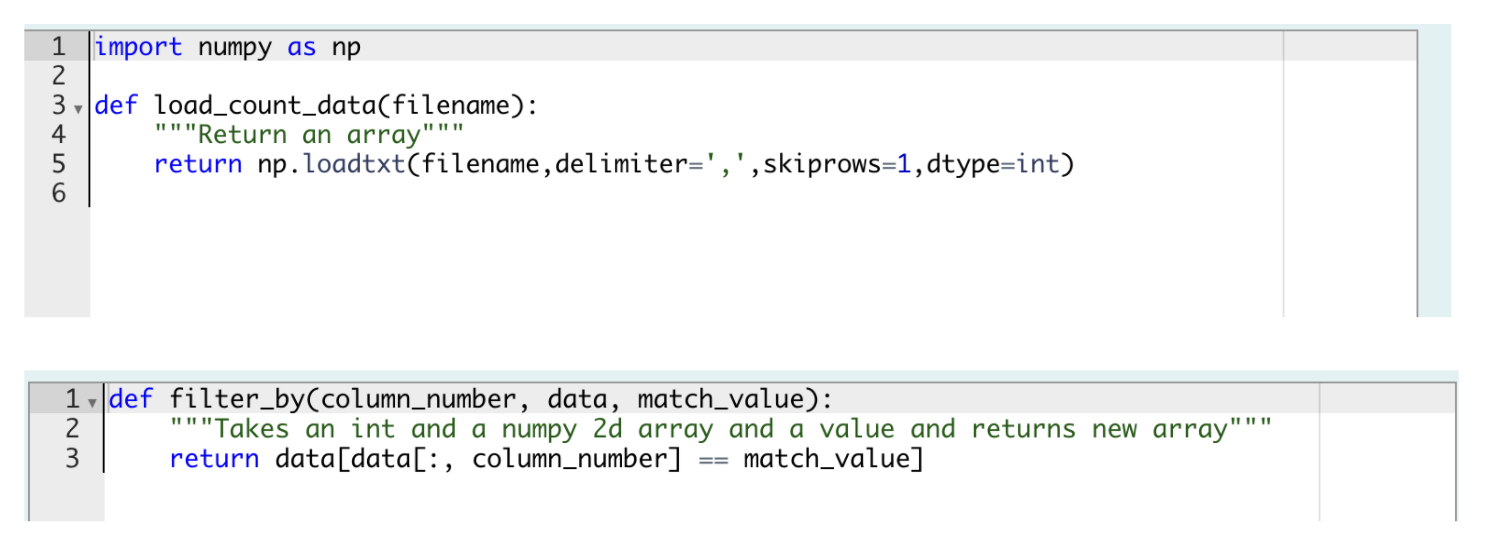
Question 10 Not complete Marked out of 10.00 P Flag question The plot of daily traffic is very jagged because of the weekly variation, with big variations between weekday and weekend traffic flows. For some applications it would be more convenient to display a bar chart showing the total flows for each week of the year. In preparation for such a bar chart, write a function weekly_totals(data, site_id, year, weight_class) that takes as parameters a numpy array of traffic count data as returned by load_count_data, a site ID, a year and weight class (1 or 2 for light and heavy respectively) and returns a numpy array of 52 numbers. The first number is the total count of vehicles of the specified weight class at the given site in week number 1 in the given year. The second is the total for week number 2, and so on. The week number in the year is the value in the column WEEK_OF_YEAR_COL (= 3) in each row of the count data table. The function must compute a total for every week number from 1 to 52 inclusive, even though some data sets will be missing some weeks. The value for a missing week should be zero. The answer box must include, in order: 1. An import of numpy. 2. The standard set of global constants. 3. Your load_count_data function (needed for testing). 4. Your filter_by function (which you should need for weekly_totals). 5. Any other support functions you define. 6. Your weekly_totals function. For example: Test Result Year 2018: [57102 44471 43549] ... [41192 42149 51397] Year 2019: (55412 46282 46087) (39973 40288 49149] Year 2020: [53492 45632 47826] ... [49172 37417 40070] Year 2021: [45955 43402 38190] ... [0 0 0] # Print weekly totals for light traffic for several years. # Print only first 3 and last 3 for each year. data = load_count_data('counts_5a.txt') for year in [2018, 2019, 2020, 2021] : totals = weekly_totals(data, 473058, year, WEIGHT_CLASS_LIGHT) if len(totals) == 52: print (f"Year {year}: {totals[0:3]} ... {totals [-3:])") else: print (f"Year {year}: expected 52 values, got {len(totals))") # Print only first 3 and last 3 for each site in sites_5a. data = load_count_data('counts_5a.txt') for site_id in [2183, 6542, 473050, 4661, 1983]: totals = weekly_totals(data, site_id, 2019, WEIGHT_CLASS_HEAVY) if len(totals) == 52: print("Site {site_id): {totals [6:3}} ... {totals (-3:]}") else: print("Site {site_id): expected 52 values, got {len(totals)}") Site 2103: (12588 20922 1967) ... [29096 18970 10558] Site 6542: [ 9510 16974 17633) ... (28766 18635 8512) Site 473050: [2658 2319 2285] ... [2252 2100 2393] Site 4661: [@ @ ] ... [9711 9523 8996) Site 1903: [4021 3437 3138] ... [2955 3245 3755] o 1 import numpy as np 2 3 v def load_count_data(filename): 4 ""Return an array" 5 return np.loadtxt(filename, delimiter=',',skiprows=1, dtype=int) 6 II TT 11 WN 1 v def filter_by(column_number, data, match_value): 2 "" "Takes an int and a numpy 2d array and a value and returns new array""". 3 return data[data[:, column_number] match_value] ==
Step by Step Solution
There are 3 Steps involved in it

Get step-by-step solutions from verified subject matter experts