

Question: Python Modules Consider the following data depicting the account balance and the expenses of a client during the first nine days of the month: 1.
Python Modules
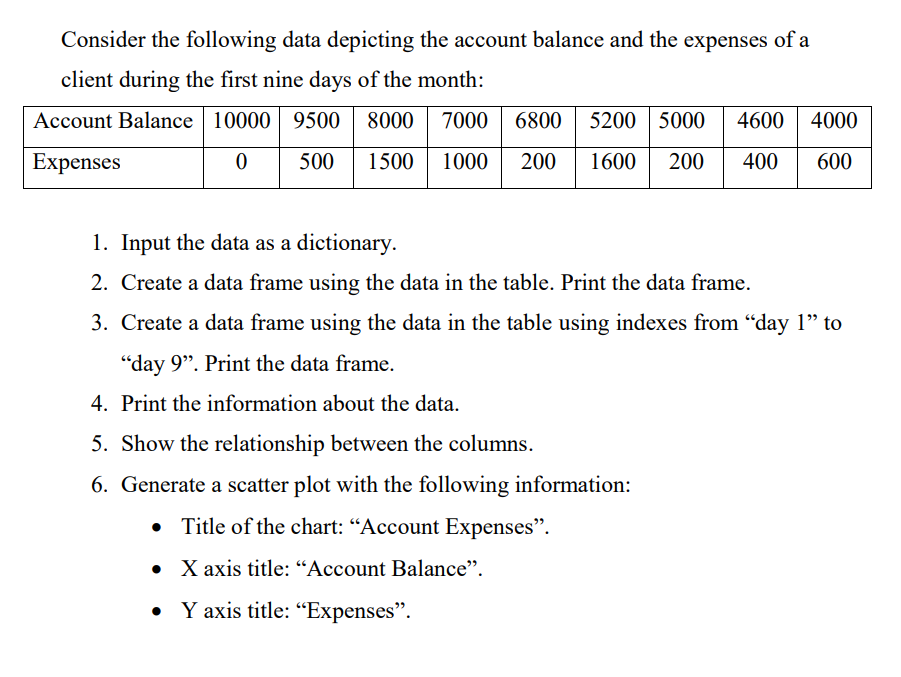
Consider the following data depicting the account balance and the expenses of a client during the first nine days of the month: 1. Input the data as a dictionary. 2. Create a data frame using the data in the table. Print the data frame. 3. Create a data frame using the data in the table using indexes from "day 1 " to "day 9". Print the data frame. 4. Print the information about the data. 5. Show the relationship between the columns. 6. Generate a scatter plot with the following information: - Title of the chart: "Account Expenses". - X axis title: "Account Balance". - Y axis title: "Expenses
Step by Step Solution
There are 3 Steps involved in it
1 Expert Approved Answer
Step: 1 Unlock

Question Has Been Solved by an Expert!
Get step-by-step solutions from verified subject matter experts
Step: 2 Unlock
Step: 3 Unlock