

Question: PYTHON NEEDED!!! 1) Plot the graph of the following functions a) on the same graph using different colors and different line types. Use grid on
PYTHON NEEDED!!!
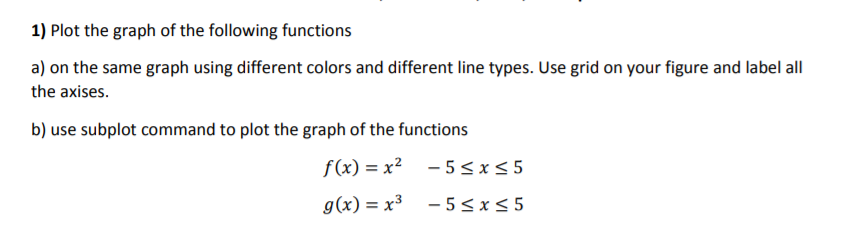
1) Plot the graph of the following functions a) on the same graph using different colors and different line types. Use grid on your figure and label all the axises. b) use subplot command to plot the graph of the functions f(x) = x2 -55x55 g(x) = x3 -5
Step by Step Solution
There are 3 Steps involved in it
1 Expert Approved Answer
Step: 1 Unlock

Question Has Been Solved by an Expert!
Get step-by-step solutions from verified subject matter experts
Step: 2 Unlock
Step: 3 Unlock