

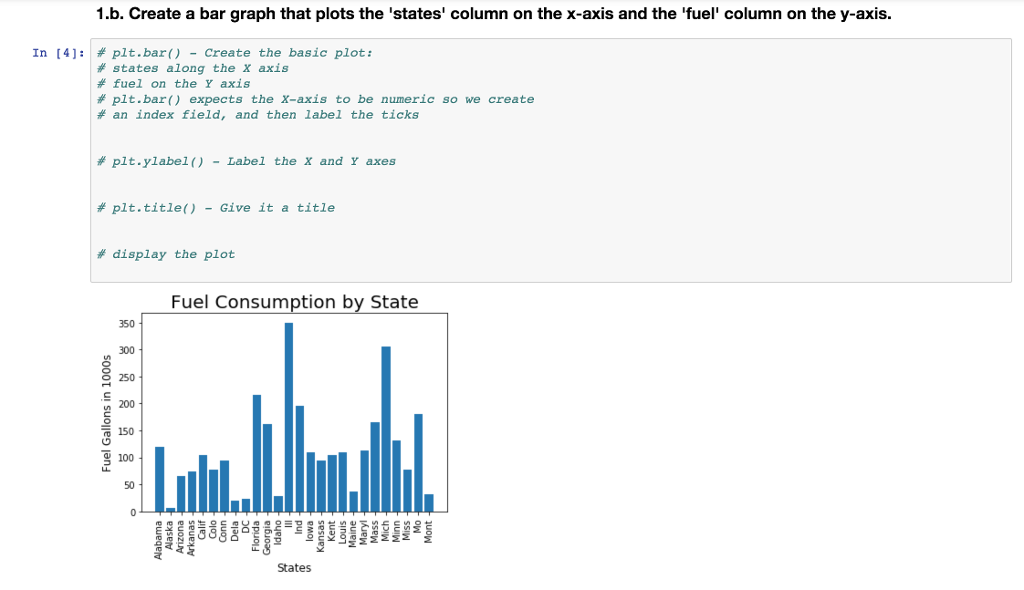
Question: %%%python - Notebook Jupitar %%% ~ Thank you 'road.csv' file States,deaths,drivers,popden,rural,temp,fuel Alabama,968,158,64,66,62,119 Alaska,43,11,0.4,5.9,30,6.2 Arizona,588,91,12,33,64,65 Arkanas,640,92,34,73,51,74 Calif,4743,952,100,118,65,105 Colo,566,109,17,73,42,78 Conn,325,167,518,5.1,37,95 Dela,118,30,226,3.4,41,20 DC,115,35,12524,0,44,23 Florida,1545,298,91,57,67,216 Georgia,1302,203,68,83,54,162 Idaho,262,41,8.1,40,36,29 Ill,2207,544,180,102,33,350 Ind,1410,254,129,89,37,196
%%%python - Notebook Jupitar %%% ~ Thank you
'road.csv' file
States,deaths,drivers,popden,rural,temp,fuel Alabama,968,158,64,66,62,119 Alaska,43,11,0.4,5.9,30,6.2 Arizona,588,91,12,33,64,65 Arkanas,640,92,34,73,51,74 Calif,4743,952,100,118,65,105 Colo,566,109,17,73,42,78 Conn,325,167,518,5.1,37,95 Dela,118,30,226,3.4,41,20 DC,115,35,12524,0,44,23 Florida,1545,298,91,57,67,216 Georgia,1302,203,68,83,54,162 Idaho,262,41,8.1,40,36,29 Ill,2207,544,180,102,33,350 Ind,1410,254,129,89,37,196 Iowa,833,150,49,100,30,109 Kansas,669,136,27,124,42,94 Kent,911,147,76,65,44,104 Louis,1037,146,72,40,65,109 Maine,1196,46,31,19,30,37 Maryl,616,157,314,29,44,113 Mass,766,255,655,17,37,166 Mich,2120,403,137,95,33,306 Minn,841,189,43,110,22,132 Miss,648,85,46,59,57,77 Mo,1289,234,63,100,40,180 Mont,259,38,4.6,72,29,31
Exercise 1 - Bar Graphs (In-class Demo) 1.a. Set up the dataframe .Download 'road.csv' file Import matplotlib and pandas libraries Read it into a dataframe In [2]: | # Type your code here Populating the interactive namespace from numpy and matplotlib
Step by Step Solution
There are 3 Steps involved in it

Get step-by-step solutions from verified subject matter experts