

Question: %%%python - Notebook Jupitar %%% ~ Thank you 'road.csv' file States,deaths,drivers,popden,rural,temp,fuel Alabama,968,158,64,66,62,119 Alaska,43,11,0.4,5.9,30,6.2 Arizona,588,91,12,33,64,65 Arkanas,640,92,34,73,51,74 Calif,4743,952,100,118,65,105 Colo,566,109,17,73,42,78 Conn,325,167,518,5.1,37,95 Dela,118,30,226,3.4,41,20 DC,115,35,12524,0,44,23 Florida,1545,298,91,57,67,216 Georgia,1302,203,68,83,54,162 Idaho,262,41,8.1,40,36,29 Ill,2207,544,180,102,33,350 Ind,1410,254,129,89,37,196
%%%python - Notebook Jupitar %%% ~ Thank you
'road.csv' file
States,deaths,drivers,popden,rural,temp,fuel Alabama,968,158,64,66,62,119 Alaska,43,11,0.4,5.9,30,6.2 Arizona,588,91,12,33,64,65 Arkanas,640,92,34,73,51,74 Calif,4743,952,100,118,65,105 Colo,566,109,17,73,42,78 Conn,325,167,518,5.1,37,95 Dela,118,30,226,3.4,41,20 DC,115,35,12524,0,44,23 Florida,1545,298,91,57,67,216 Georgia,1302,203,68,83,54,162 Idaho,262,41,8.1,40,36,29 Ill,2207,544,180,102,33,350 Ind,1410,254,129,89,37,196 Iowa,833,150,49,100,30,109 Kansas,669,136,27,124,42,94 Kent,911,147,76,65,44,104 Louis,1037,146,72,40,65,109 Maine,1196,46,31,19,30,37 Maryl,616,157,314,29,44,113 Mass,766,255,655,17,37,166 Mich,2120,403,137,95,33,306 Minn,841,189,43,110,22,132 Miss,648,85,46,59,57,77 Mo,1289,234,63,100,40,180 Mont,259,38,4.6,72,29,31
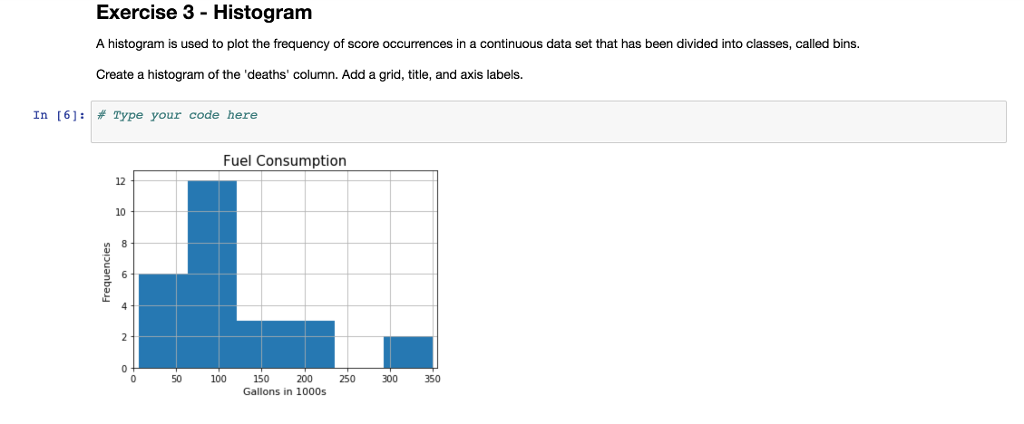
Exercise 3 - Histogram A histogram is used to plot the frequency of score occurrences in a continuous data set that has been divided into classes, called bins. Create a histogram of the 'deaths' column. Add a grid, title, and axis labels. In [6]: # Type your code here Fuel Consumption 12 10 0 100 0 200 250300350 Gallons in 1000s
Step by Step Solution
There are 3 Steps involved in it

Get step-by-step solutions from verified subject matter experts