

Question: Python pandas, matplotlib -- how to use column as y index, and label axes? I have the following data set data3.csv: Hours_Studied,Grade 15,98 6,75 14,97
Python pandas, matplotlib -- how to use column as y index, and label axes?
I have the following data set data3.csv:
Hours_Studied,Grade 15,98 6,75 14,97 18,99 2,61 4,67 8,82 10,88
And the following program to plot the data:
from PIL import Image import sys import matplotlib matplotlib.use('Agg') import matplotlib.pyplot as plt import numpy as np import pandas as pd
#store the dataframe in a variable pl = pd.read_csv('data3.csv') #use the plot method on the data to draw a plot pl.plot() #save the plot to a file plt.savefig("plot.png")
#open the image file with Image.open("plot.png") as img: img.load() #print the image print(img.show())
My output looks like this:
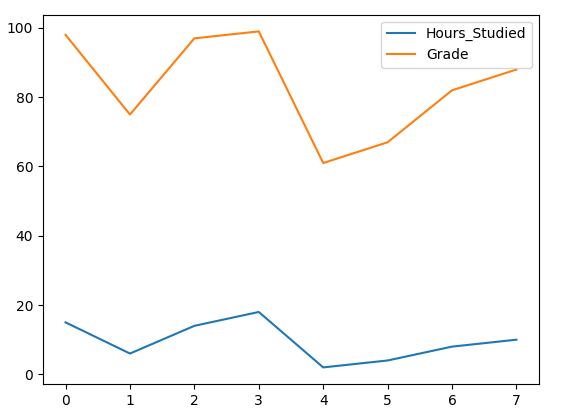
How can I modify my program so that instead of the index values 0-7 being used as the x axis values, one column (Hours Studied) is used as the x axis and the other column (Grade) is used as the y axis? Also, is there a way to label the axes?
Step by Step Solution
There are 3 Steps involved in it

Get step-by-step solutions from verified subject matter experts