

Question: (Python Pandas Plotly Express) Please help me figure out why my labels and legend are not displaying. pio. templates.default = simple_white px.defaults.template = ggplot2 px.defaults.color_continuous_scale
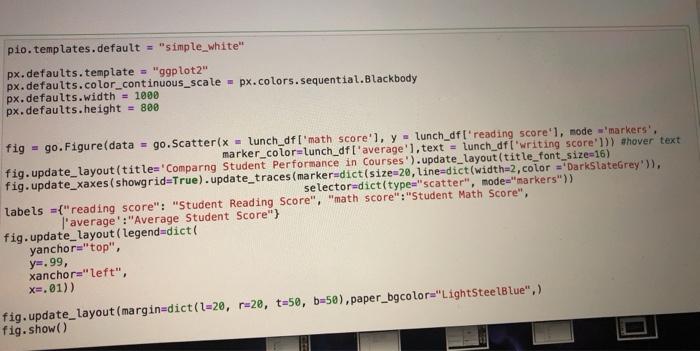
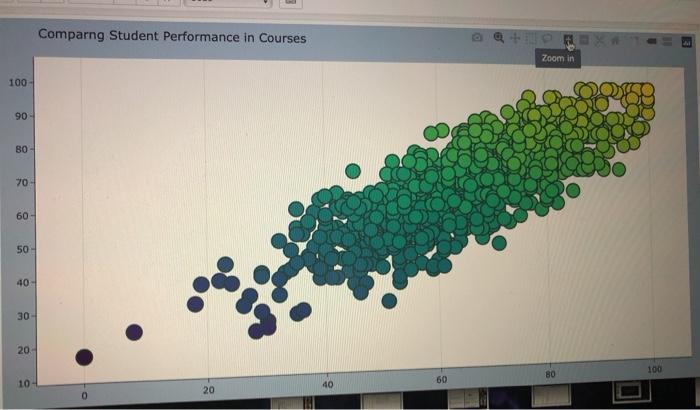
pio. templates.default = "simple_white" px.defaults.template = "ggplot2" px.defaults.color_continuous_scale - px.colors.sequential.Blackbody px.defaults.width = 1000 px.defaults.height = 800 fig = go.Figure(data = go. Scatter(x - lunch_df ['math score'l, y - lunch_df ' reading score'), mode 'markers', marker_color=Lunch_df ['average'], text = lunch_dfi'writing score'])) ahover text fig.update_layout(title='Comparng Student Performance in Courses') .update_layout(title_font_size=16) fig.update_xaxes(showgrid=True).update_traces (marker=dict(size=20,line-dict(width=2, color ="DarkSlateGrey's), selector-dict(type"scatter", mode="markers" labels ={"reading score": "Student Reading Score", "math score":"Student Math Score", l'average':"Average Student Score"} fig.update_layout(legend=dict yanchor="top", y=.99, xanchor="left", x=,01)) fig.update_layout (margin=dict(l=28, r=2e, t=50, b=50),paper_bgcolor="LightSteelBlue",) fig.show() Comparng Student Performance in Courses Zoom in 100 90 BO- 70 60 50- 40 30 20 100 BO 60 10 40 20 pio. templates.default = "simple_white" px.defaults.template = "ggplot2" px.defaults.color_continuous_scale - px.colors.sequential.Blackbody px.defaults.width = 1000 px.defaults.height = 800 fig = go.Figure(data = go. Scatter(x - lunch_df ['math score'l, y - lunch_df ' reading score'), mode 'markers', marker_color=Lunch_df ['average'], text = lunch_dfi'writing score'])) ahover text fig.update_layout(title='Comparng Student Performance in Courses') .update_layout(title_font_size=16) fig.update_xaxes(showgrid=True).update_traces (marker=dict(size=20,line-dict(width=2, color ="DarkSlateGrey's), selector-dict(type"scatter", mode="markers" labels ={"reading score": "Student Reading Score", "math score":"Student Math Score", l'average':"Average Student Score"} fig.update_layout(legend=dict yanchor="top", y=.99, xanchor="left", x=,01)) fig.update_layout (margin=dict(l=28, r=2e, t=50, b=50),paper_bgcolor="LightSteelBlue",) fig.show() Comparng Student Performance in Courses Zoom in 100 90 BO- 70 60 50- 40 30 20 100 BO 60 10 40 20
Step by Step Solution
There are 3 Steps involved in it

Get step-by-step solutions from verified subject matter experts