

Question: python please for the commented steps Exploring and Visualizing The Data Exploring your data using different types of visualizations is always a good practice when
 python please for the commented steps
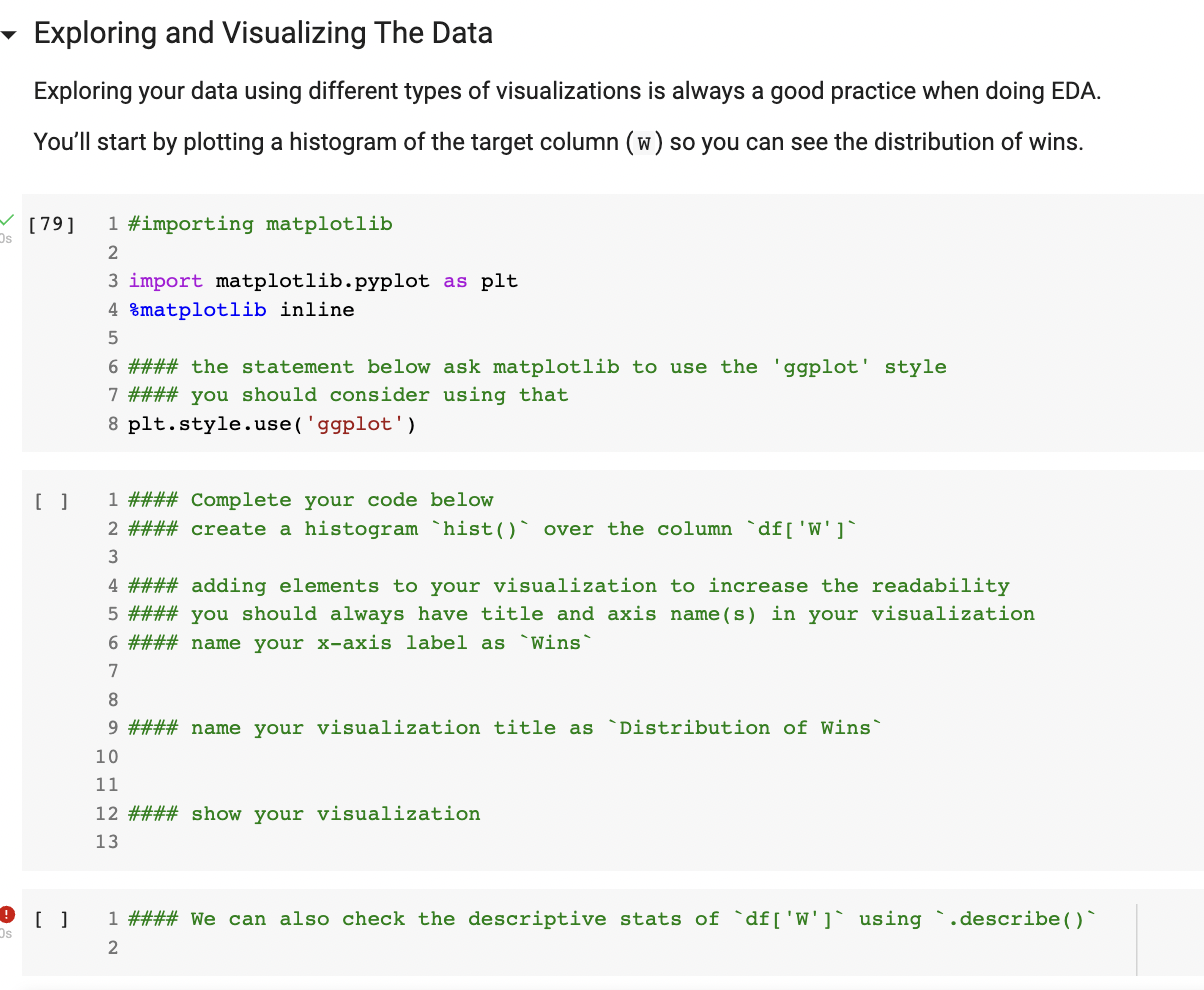
Exploring and Visualizing The Data Exploring your data using different types of visualizations is always a good practice when doing EDA. You'll start by plotting a histogram of the target column ( w) so you can see the distribution of wins. [79] 1 \#importing matplotlib 2 3 import matplotlib.pyplot as plt 4 omatplotlib inline 5 6 \#\#\#\# the statement below ask matplotlib to use the 'ggplot' style 7 \#\#\#\# you should consider using that 8 plt.style.use('ggplot') [ ] 1 \#\#\#\# Complete your code below 2 \#\#\#\# create a histogram 'hist()' over the column 'df[' ' ]' 3 4 \#\#\#\# adding elements to your visualization to increase the readability 5 \#\#\#\# you should always have title and axis name(s) in your visualization 6 \#\#\#\# name your x-axis label as "Wins" 7 8 9 \#\#\#\# name your visualization title as 'Distribution of Wins' 10 11 12 \#\#\#\# show your visualization 13 [] 1 \#\#\#\# We can also check the descriptive stats of 'df['W']' using'.describe()' 2
Step by Step Solution
There are 3 Steps involved in it

Get step-by-step solutions from verified subject matter experts