

Question: Python. problem 2 A commonly used model for predicting stock prices assumes that yield rates for the stock over some period of time follow a
Python. problem 2
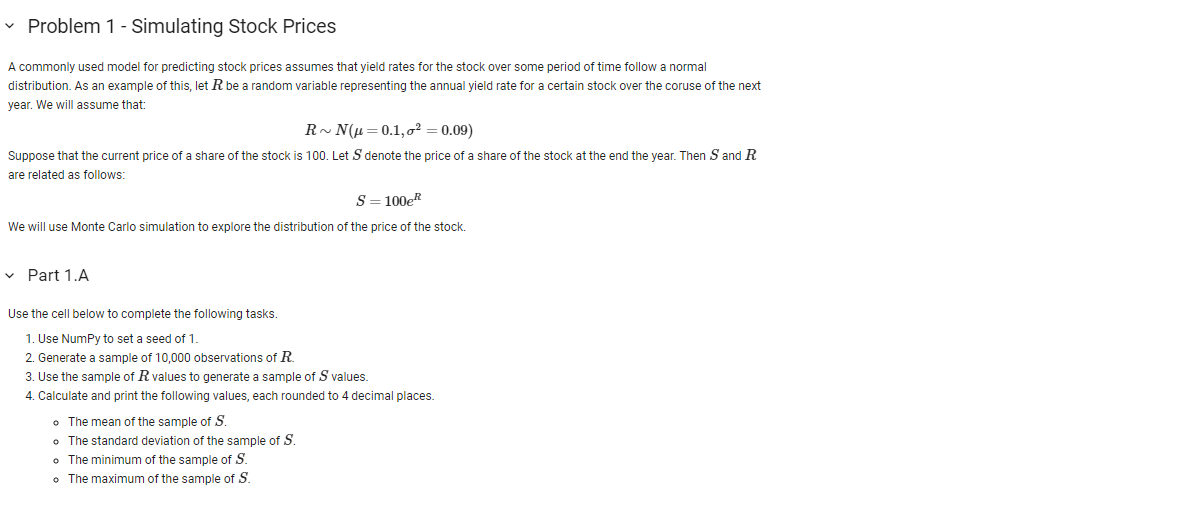
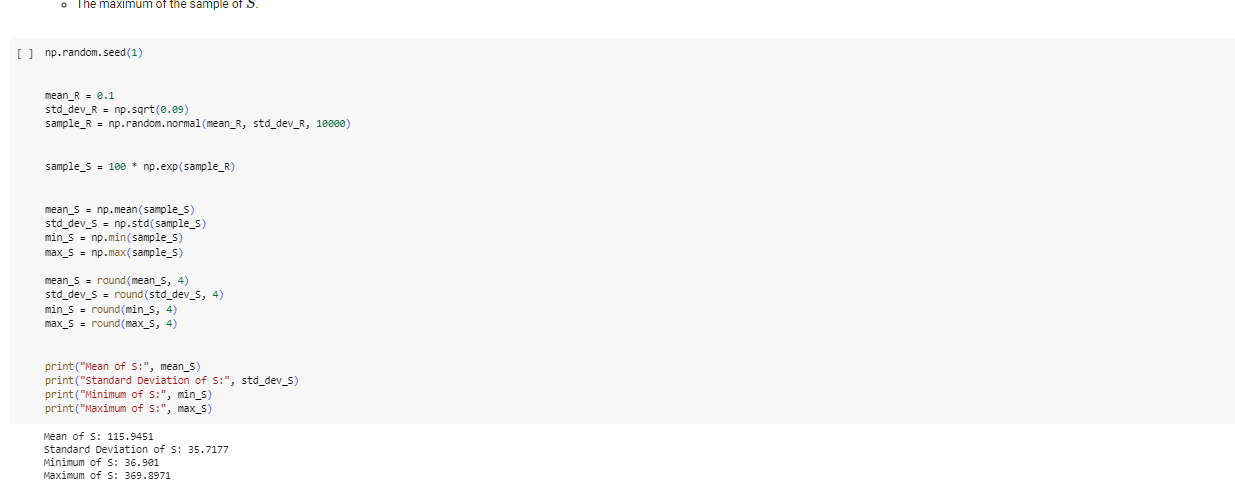
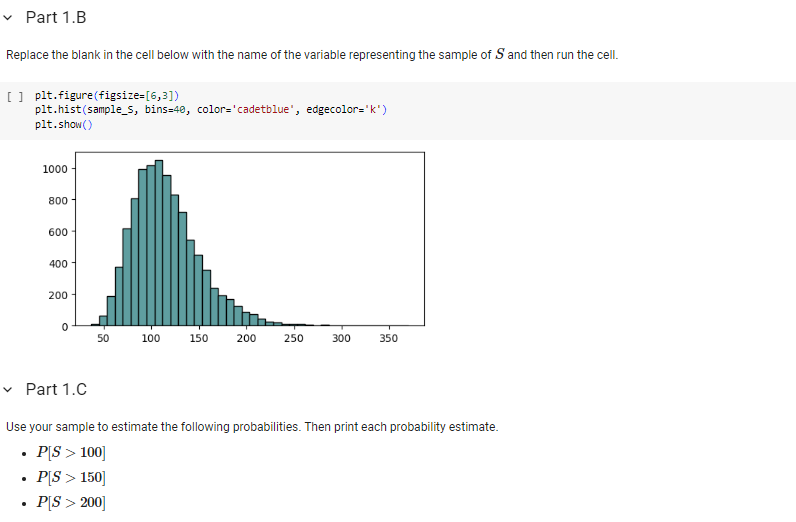
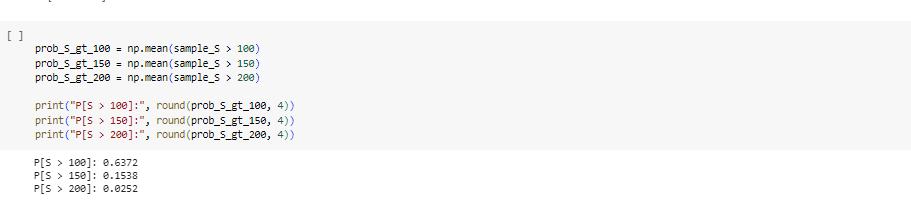
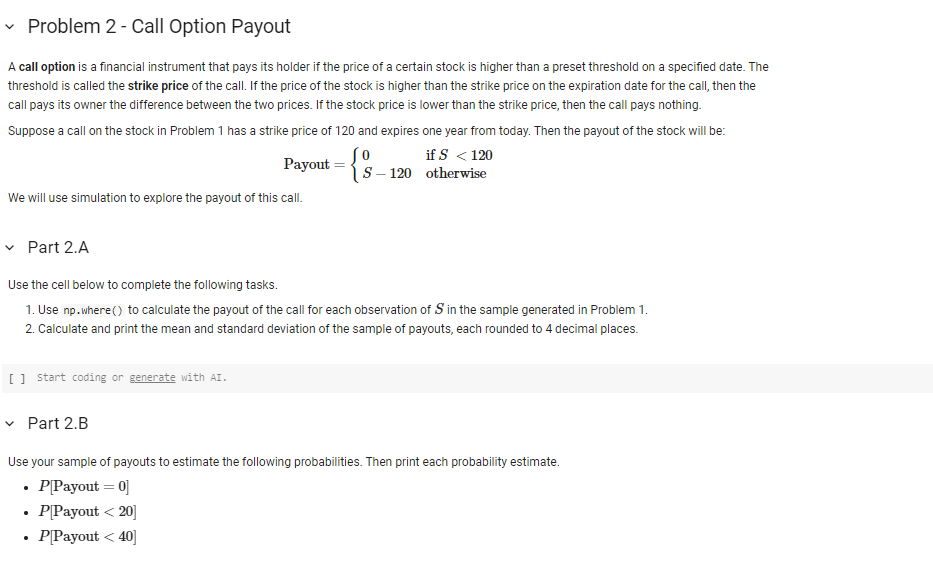
A commonly used model for predicting stock prices assumes that yield rates for the stock over some period of time follow a normal distribution. As an example of this, let R be a random variable representing the annual yield rate for a certain stock over the coruse of the next year. We will assume that: RN(=0.1,2=0.09) Suppose that the current price of a share of the stock is 100 . Let S denote the price of a share of the stock at the end the year. Then S and R are related as follows: S=100eR We will use Monte Carlo simulation to explore the distribution of the price of the stock. Part 1.A Use the cell below to complete the following tasks. 1. Use NumPy to set a seed of 1 . 2. Generate a sample of 10,000 observations of R. 3. Use the sample of R values to generate a sample of S values. 4. Calculate and print the following values, each rounded to 4 decimal places. - The mean of the sample of S. - The standard deviation of the sample of S. - The minimum of the sample of S. - The maximum of the sample of S. [ ] np.random.seed(1) mean_R =0.1 std_dev_R = np.sqrt (0.09) sample_ R=np.random.normal(mean_R, std_dev_ R, 10000) sample_s =100npexp( sample_R ) mean_s =np mean (sample_s) std_dev_s = np.std (sample_s) min_s = np.min(sample_s) max_s =npmax( sample_s ) mean_s = round (mean_s, 4) std_dev_s = round (std_dev_s, 4) min_s = round (min_s, 4) max_s = round (max_s, 4) print("Mean of s:", mean_s) print("Standard Deviation of 5:", std_dev_s) print("Minimum of S:", min_s) print("Maximum of S:", max_s) Mean of S: 115.9451 Standard Deviation of S: 35.7177 Minimum of S : 36.901 Maximum of S: 369.8971 Replace the blank in the cell below with the name of the variable representing the sample of S and then run the cell. [ ] plt.figure(figsize =[6,3] ) plt.hist (sample_s, bins=40, color='cadetblue', edgecolor=' k ') plt.show() Part 1.C Use your sample to estimate the following probabilities. Then print each probability estimate. - P[S>100] - P[S>150] - P[S>200] [ ] prob_s_gt_100 = np. mean ( sample_s >100) prob_S_gt_150 =n p. mean ( sample_s >150) prob_S_gt_200 = np. mean ( sample_s >280) print("P[S > 100]:", round (prob_s_gt_100, 4)) print ("P[S > 150]:", round (prob_s_gt_150, 4)) print ("P[S > 200]:", round (prob_s_gt_200, 4)) P[S>100]:0.6372 P[S>150]:0.1538 P[S>200]:0.0252 A call option is a financial instrument that pays its holder if the price of a certain stock is higher than a preset threshold on a specified date. The threshold is called the strike price of the call. If the price of the stock is higher than the strike price on the expiration date for the call, then the call pays its owner the difference between the two prices. If the stock price is lower than the strike price, then the call pays nothing. Suppose a call on the stock in Problem 1 has a strike price of 120 and expires one year from today. Then the payout of the stock will be: Payout={0S120ifS
Step by Step Solution
There are 3 Steps involved in it

Get step-by-step solutions from verified subject matter experts