

Question: python python python please provide the codes : ## Create Lineplot on top of a barplot for the accmulated and annual cash flow, respectively BE
python python python
please provide the codes
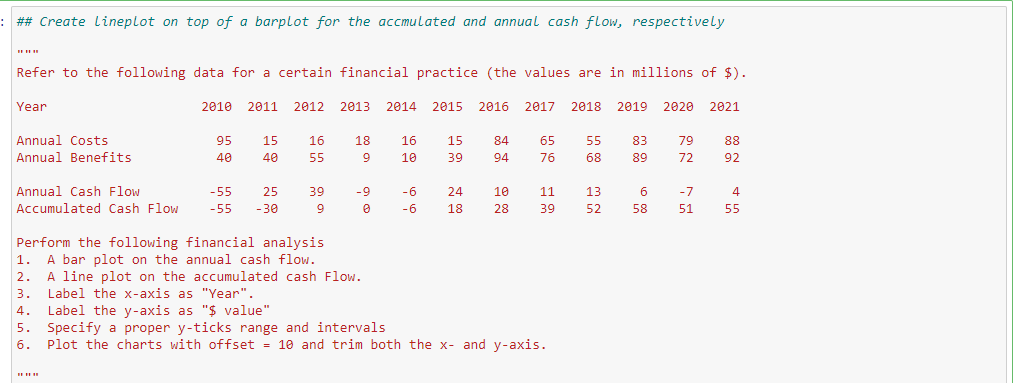
: ## Create Lineplot on top of a barplot for the accmulated and annual cash flow, respectively BE FR Refer to the following data for a certain financial practice (the values are in millions of $). Year 2010 2011 2012 2013 2014 2015 2016 2017 2018 2019 2020 2021 Annual Costs Annual Benefits 95 40 15 40 16 55 18 9 16 10 15 39 84 94 65 76 55 68 83 89 79 72 88 92 Annual Cash Flow Accumulated Cash Flow -55 -55 25 -30 39 9 -9 0 -6 -6 24 18 10 28 11 39 13 52 6 58 -7 51 4 55 Perform the following financial analysis 1. A bar plot on the annual cash flow. 2. A line plot on the accumulated cash Flow. 3. Label the x-axis as "Year". 4. Label the y-axis as "$ value" 5. Specify a proper y-ticks range and intervals 6. Plot the charts with offset = 10 and trim both the x- and y-axis
Step by Step Solution
There are 3 Steps involved in it

Get step-by-step solutions from verified subject matter experts