

Question: Python question: https://www.cse.msu.edu/~cse231/Online/Projects/Project08/Project08.pdf This is the description of the project. http://www.cse.msu.edu/~cse231/Online/Projects/Project08/storm_track1.txt This is the testing txt file. http://www.cse.msu.edu/~cse231/Online/Projects/Project08/world-map.jpg This will used in the code. I've
Python question:
https://www.cse.msu.edu/~cse231/Online/Projects/Project08/Project08.pdf
This is the description of the project.
http://www.cse.msu.edu/~cse231/Online/Projects/Project08/storm_track1.txt
This is the testing txt file.
http://www.cse.msu.edu/~cse231/Online/Projects/Project08/world-map.jpg
This will used in the code.
I've got most parts, but still can't figure out how to write display_table and prepare_plot, can someone help me with it? This is the code I wrote so far:
copy pastable code link: https://paste.ee/p/w0kNx
PLEASE !! HELP !!!
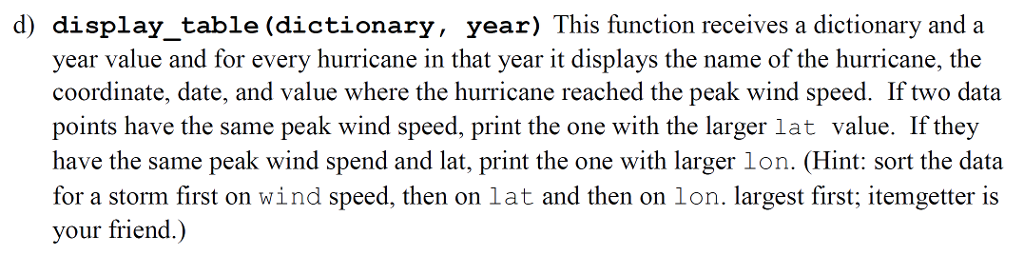
d) display_table (dictionary, year) This function receives a dictionary and a year value and for every hurricane in that year it displays the name of the hurricane, the coordinate, date, and value where the hurricane reached the peak wind speed. If two data points have the same peak wind speed, print the one with the larger lat value. If they have the same peak wind spend and lat, print the one with larger lon. (Hint: sort the data for a storm first on wind speed, then on lat and then on lon. largest first; itemgetter is your friend.)
Step by Step Solution
There are 3 Steps involved in it

Get step-by-step solutions from verified subject matter experts