

Question: Python question, using Spyder Use a histogram to show the mark distribution of the following test. test = [12, 37, 87, 70, 70, 19, 45,
Python question, using Spyder
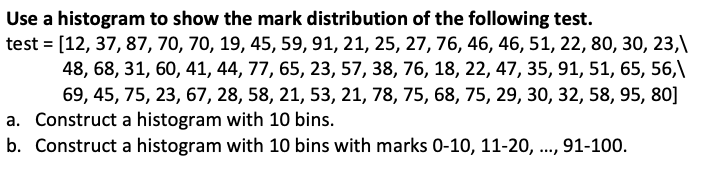
Use a histogram to show the mark distribution of the following test. test = [12, 37, 87, 70, 70, 19, 45, 59, 91, 21, 25, 27, 76, 46, 46, 51, 22, 80, 30, 23, 48, 68, 31, 60, 41, 44, 77, 65, 23, 57, 38, 76, 18, 22, 47, 35, 91, 51, 65, 56, 69, 45, 75, 23, 67, 28, 58, 21, 53, 21, 78, 75, 68, 75, 29, 30, 32, 58, 95, 80] a. Construct a histogram with 10 bins. b. Construct a histogram with 10 bins with marks 0-10, 11-20, ..., 91-100
Step by Step Solution
There are 3 Steps involved in it
1 Expert Approved Answer
Step: 1 Unlock

Question Has Been Solved by an Expert!
Get step-by-step solutions from verified subject matter experts
Step: 2 Unlock
Step: 3 Unlock