

Question: Q 0 1 2 3 4 5 6 7 P 12 11 10 9 8 7 6 5 TC 2 6 9 12 16 21
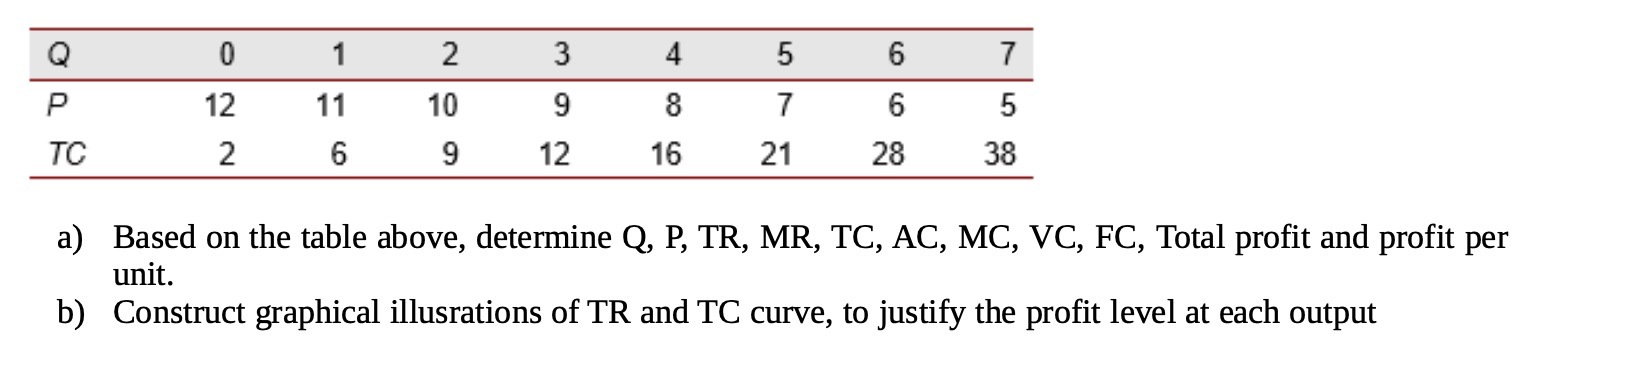
Q 0 1 2 3 4 5 6 7 P 12 11 10 9 8 7 6 5 TC 2 6 9 12 16 21 28 38 a) Based on the table above, determine Q, P, TR, MR, TC, AC, MC, VC, FC, Total profit and profit per unit. b) Construct graphical illusrations of TR and TC curve, to justify the profit level at each output
Step by Step Solution
There are 3 Steps involved in it
1 Expert Approved Answer
Step: 1 Unlock

Question Has Been Solved by an Expert!
Get step-by-step solutions from verified subject matter experts
Step: 2 Unlock
Step: 3 Unlock