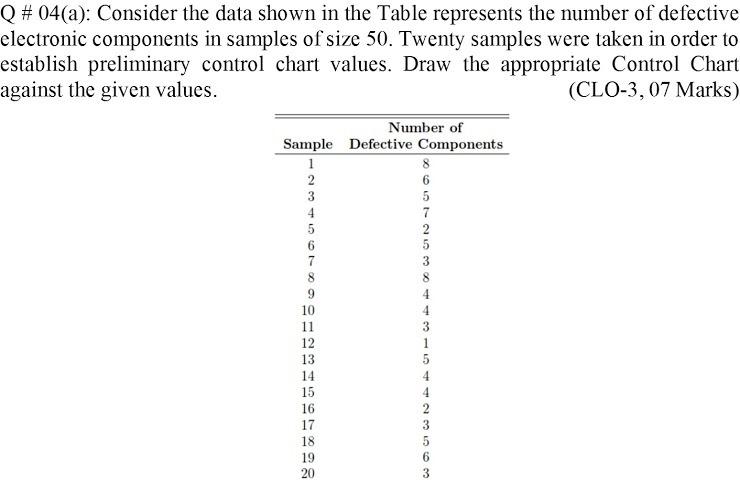
Question: Q # 04(a): Consider the data shown in the Table represents the number of defective electronic components in samples of size 50. Twenty samples were

Q # 04(a): Consider the data shown in the Table

Q # 04(a): Consider the data shown in the Table represents the number of defective electronic components in samples of size 50. Twenty samples were taken in order to establish preliminary control chart values. Draw the appropriate Control Chart against the given values. (CLO-3, 07 Marks) Number of Sample Defective Components 1 8 2 6 3 5 4 7 5 2 5 7 3 8 8 9 4 10 4 11 3 12 1 13 5 14 4 15 4 16 2 17 3 18 5 19 6 20 3

Step by Step Solution

There are 3 Steps involved in it

1 Expert Approved Answer
Step: 1 Unlock blur-text-image
Question Has Been Solved by an Expert!

Get step-by-step solutions from verified subject matter experts

Step: 2 Unlock
Step: 3 Unlock

Students Have Also Explored These Related General Management Questions!