

Question: Q 1 1 . 1 Use data on Table 1 1 . 1 to perform the normality test using other methods, i . e .
Q Use data on Table to perform the normality test using other methods, ie JarqueBera, AndersonDarling and Lilliefors tests, and compare the results with the ShapiroWilk's test of Example Problem
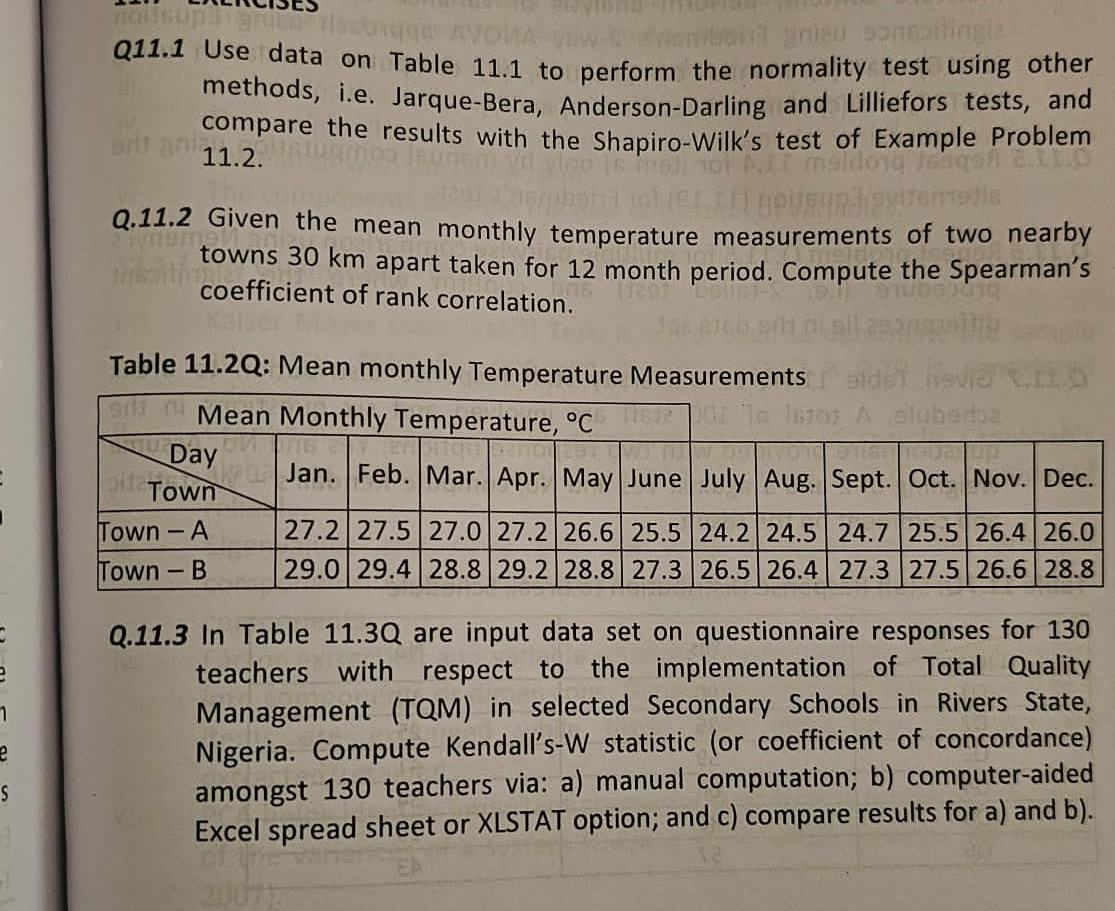
Q Given the mean monthly temperature measurements of two nearby towns apart taken for month period. Compute the Spearman's coefficient of rank correlation.
Table Q: Mean monthly Temperature Measurements
tableMean Monthly Temperature, DayJan.,Feb.,Mar.,Apr.,May,June,July,Aug.,Sept.,Oct.,Nov.,Dec.TownTownATownB
Q In Table Q are input data set on questionnaire responses for teachers with respect to the implementation of Total Quality Management TQM in selected Secondary Schools in Rivers State, Nigeria. Compute Kendall'sW statistic or coefficient of concordance amongst teachers via: a manual computation; b computeraided Excel spread sheet or XLSTAT option; and c compare results for a and b
Step by Step Solution
There are 3 Steps involved in it
1 Expert Approved Answer
Step: 1 Unlock

Question Has Been Solved by an Expert!
Get step-by-step solutions from verified subject matter experts
Step: 2 Unlock
Step: 3 Unlock