

Question: Q 1 . ( 2 5 points ) 2 . 1 . Use Figure 2 . 2 4 to estimate low - range and high
Q points
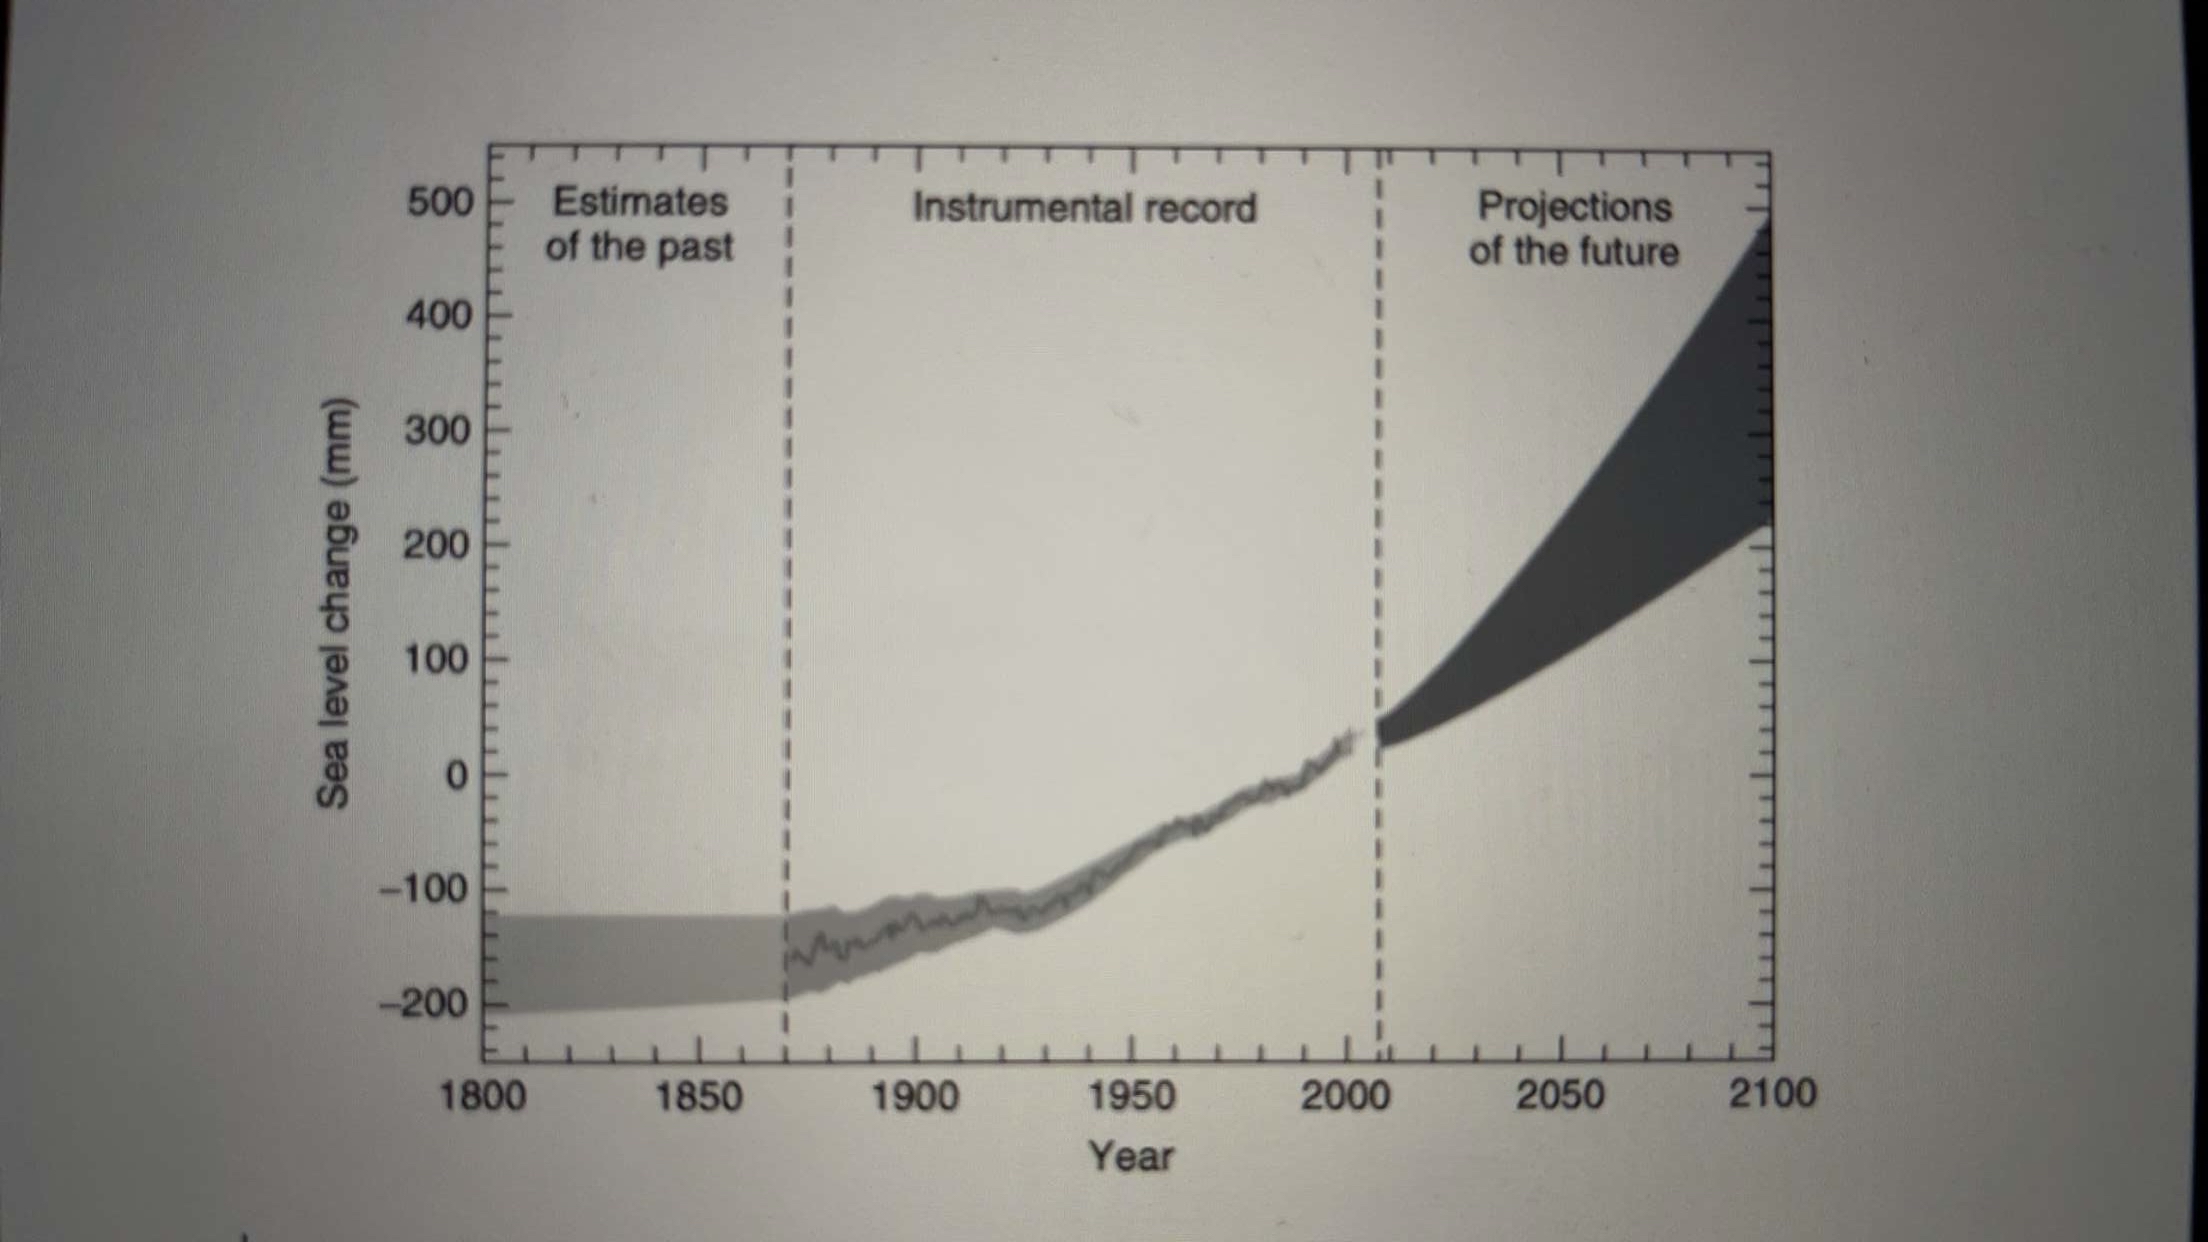
Use Figure to estimate lowrange and highrange projected rates of sea level rise in the year assuming the rate of increase will continue at the same rate in the period when the instrumental record started Convert these rates to inches per year.
Step by Step Solution
There are 3 Steps involved in it
1 Expert Approved Answer
Step: 1 Unlock

Question Has Been Solved by an Expert!
Get step-by-step solutions from verified subject matter experts
Step: 2 Unlock
Step: 3 Unlock