Question: Q #1 (Computing holding-period returns) a. From the price data here, [ , compute the holding-period returns for Jazman and Solomon for periods 2, 3
Q #1
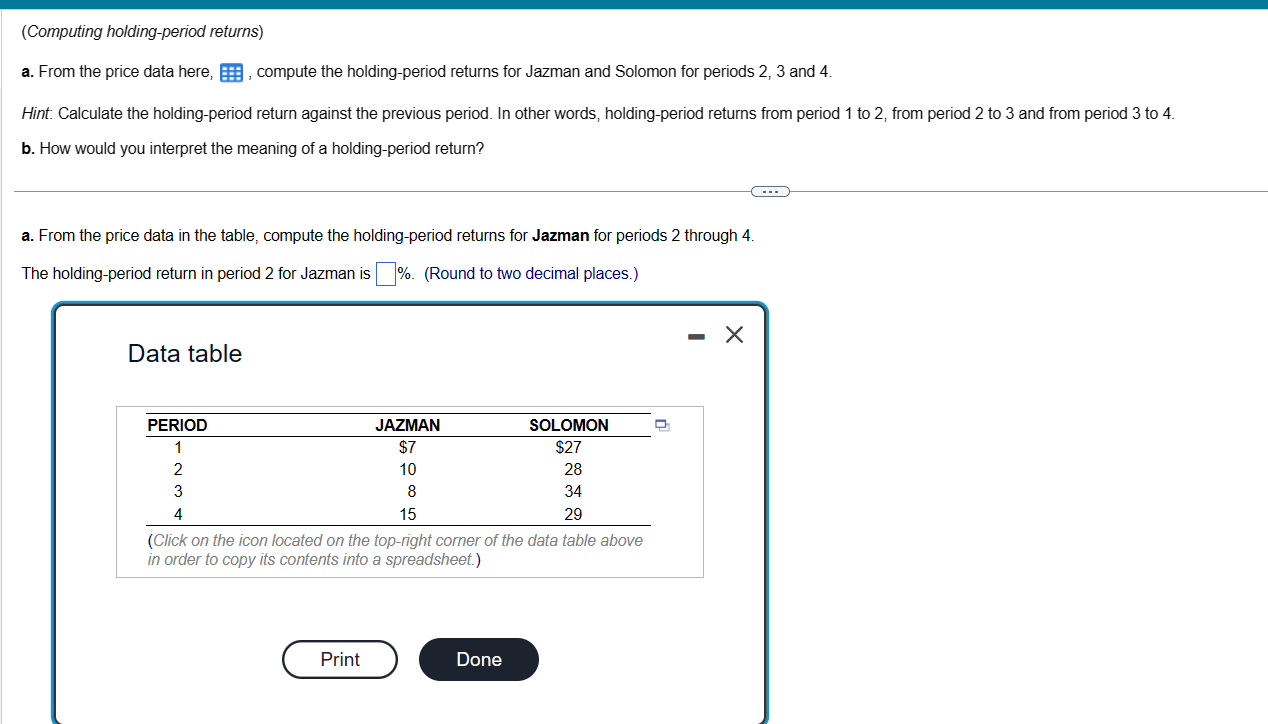
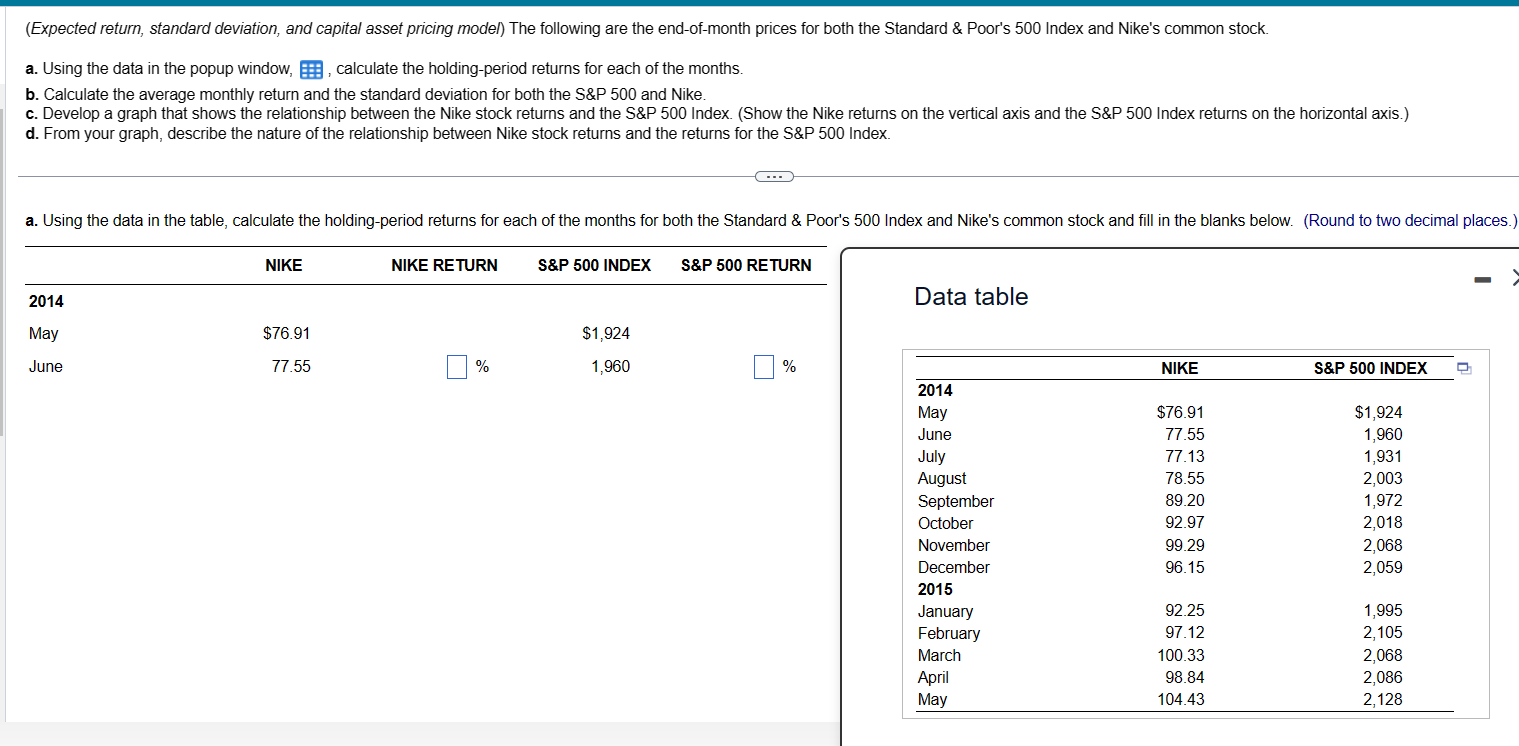
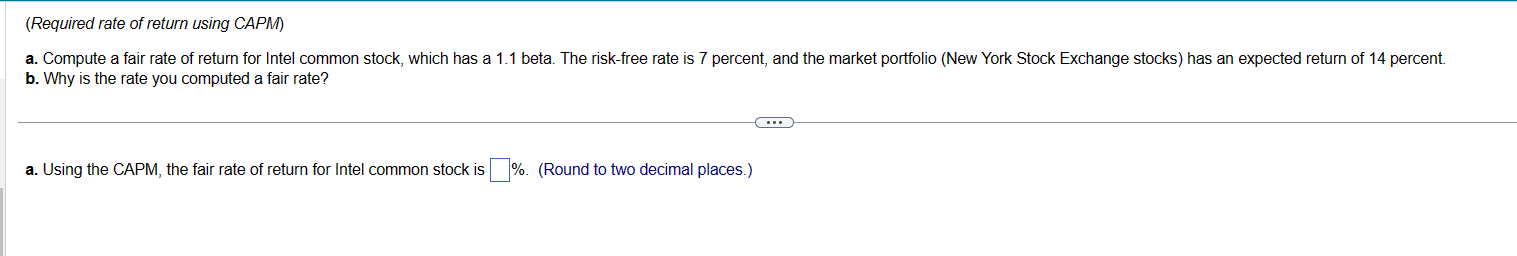
(Computing holding-period returns) a. From the price data here, [ , compute the holding-period returns for Jazman and Solomon for periods 2, 3 and 4. Hint. Calculate the holding-period return against the previous period. In other words, holding-period returns from period 1 to 2, from period 2 to 3 and from period 3 to 4. b. How would you interpret the meaning of a holding-period return? a. From the price data in the table, compute the holding-period returns for Jazman for periods 2 through 4. The holding-period return in period 2 for Jazman is |%. (Round to two decimal places.) X Data table PERIOD JAZMAN SOLOMON $7 $27 10 28 AWN 8 34 15 29 (Click on the icon located on the top-right corner of the data table above in order to copy its contents into a spreadsheet.) Print Done(Expected return, standard deviation, and capital asset pricing model) The following are the end-of-month prices for both the Standard & Poor's 500 Index and Nike's common stock. a. Using the data in the popup window, , calculate the holding-period returns for each of the months. b. Calculate the average monthly return and the standard deviation for both the S&P 500 and Nike. c. Develop a graph that shows the relationship between the Nike stock returns and the S&P 500 Index. (Show the Nike returns on the vertical axis and the S&P 500 Index returns on the horizontal axis.) d. From your graph, describe the nature of the relationship between Nike stock returns and the returns for the S&P 500 Index. a. Using the data in the table, calculate the holding-period returns for each of the months for both the Standard & Poor's 500 Index and Nike's common stock and fill in the blanks below. (Round to two decimal places NIKE NIKE RETURN S&P 500 INDEX S&P 500 RETURN 2014 Data table May $76.91 $1,924 June 77.55 % 1,960 % NIKE &P 500 INDEX 2014 May $76.91 $1,924 June 77.55 1,960 July 77.13 1,931 August 78.55 2,003 September 89.20 1,972 October 92.97 2,018 November 99.29 2,068 December 96.15 2,059 2015 January 92.25 1,995 February 97.12 2, 105 March 100.33 2,068 April 98.84 2,086 May 104.43 2, 128(Required rate of return using CAPM) a. Compute a fair rate of return for Intel common stock, which has a 1.1 beta. The risk-free rate is 7 percent, and the market portfolio (New York Stock Exchange stocks) has an expected return of 14 percent. b. Why is the rate you computed a fair rate? a. Using the CAPM, the fair rate of return for Intel common stock is |%. (Round to two decimal places.)
Step by Step Solution
There are 3 Steps involved in it
1 Expert Approved Answer
Step: 1 Unlock
Question Has Been Solved by an Expert!
Get step-by-step solutions from verified subject matter experts
Step: 2 Unlock
Step: 3 Unlock
Students Have Also Explored These Related Accounting Questions!