

Question: Q 1 ) In this question, you will approximate the function f ( x ) = e 4 x using Taylor's approximation in Python. Follow
Q In this question, you will approximate the function using Taylor's approximation
in Python. Follow these steps:
Write the fourth order Taylor's approximation of around Do this by hand.
In Python, create an array named containing numbers evenly distributed between
and
For each value in plot and its Taylor approximations at the th stndrd and
th orders, all around See the hint at the end of the question. Include this plot in
your report.
Discuss how the accuracy of the approximation changes as you increase the order of the
Taylor approximations.
For each point in plot the percentage of the absolute value of relative error for each
Taylor approximation order th to th of around Add this plot to your
report.
Describe how the error changes as the value of increases.
Include the Python code used for these steps in your report.
Hint:
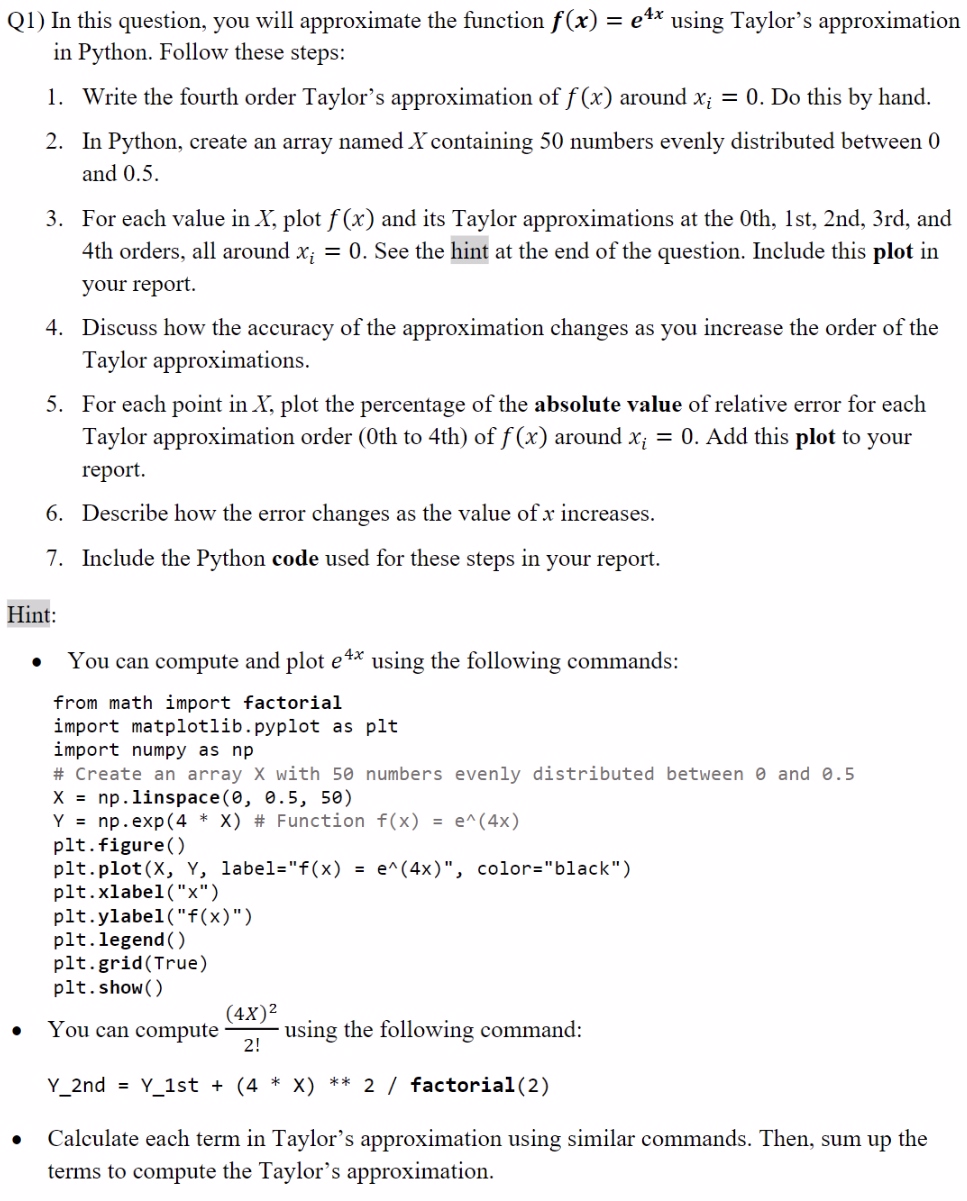
You can compute and plot using the following commands:
from math import factorial
import matplotlib.pyplot as plt
import numpy as
# Create an array X with numbers evenly distributed between and
linspace
# Function
pltfigure
pltplot X Y labelfx color"black"
pltxlabelx
pltylabelfx
plt legend
pltgridTrue
pltshowQ In this question, you will approximate the function using Taylor's approximation
in Python. Follow these steps:
Write the fourth order Taylor's approximation of around Do this by hand.
In Python, create an array named containing numbers evenly distributed between
and
For each value in plot and its Taylor approximations at the th stndrd and
th orders, all around See the hint at the end of the question. Include this plot in
your report.
Discuss how the accuracy of the approximation changes as you increase the order of the
Taylor approximations.
For each point in plot the percentage of the absolute value of relative error for each
Taylor approximation order th to th of around Add this plot to your
report.
Describe how the error changes as the value of increases.
Include the Python code used for these steps in your report.
Hint:
You can compute and plot using the following commands:
from math import factorial
import matplotlib.pyplot as plt
import numpy as np
# Create an array X with numbers evenly distributed between and
linspace
# Function
pltfigure
pltplot X Y labelfx color"black"
pltxlabelx
pltylabelfx
pltlegend
pltgridTrue
pltshow
You can compute using the following command:
actorial
Calculate each term in Taylor's approximation using similar commands. Then, sum up the
terms to compute the Taylor's approximation.
Step by Step Solution
There are 3 Steps involved in it
1 Expert Approved Answer
Step: 1 Unlock

Question Has Been Solved by an Expert!
Get step-by-step solutions from verified subject matter experts
Step: 2 Unlock
Step: 3 Unlock