

Question: Q 1 . ( Learning Outcome 1 ) Use and apply Scilab to plot graphs of functions given the set of parametric equations for -
QLearning Outcome Use and apply Scilab to plot graphs of functions given the set
of parametric equations for :
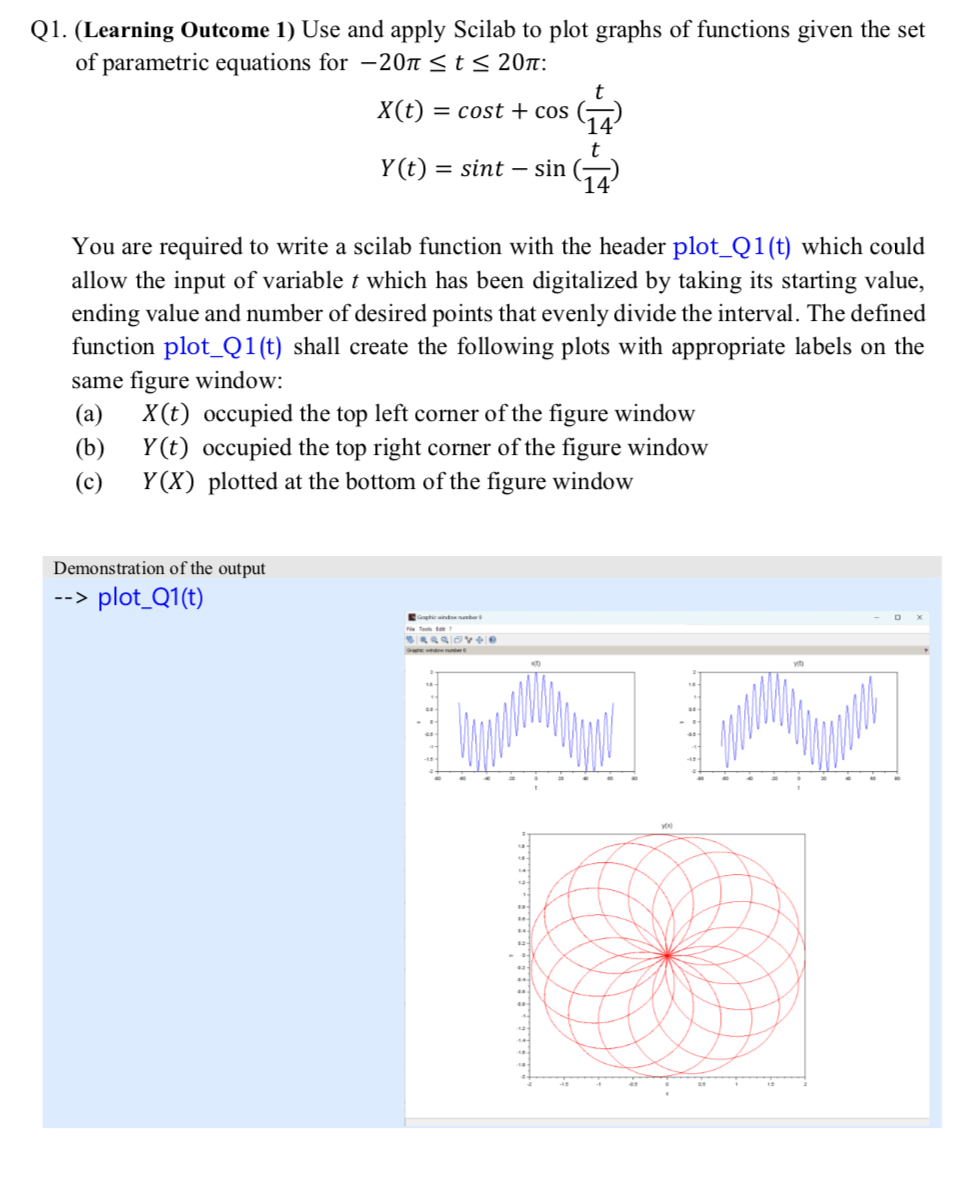
You are required to write a scilab function with the header plotQt which could allow the input of variable which has been digitalized by taking its starting value, ending value and number of desired points that evenly divide the interval. The defined function plotQt shall create the following plots with appropriate labels on the same figure window:
a occupied the top left corner of the figure window
b occupied the top right corner of the figure window
c plotted at the bottom of the figure window
Step by Step Solution
There are 3 Steps involved in it
1 Expert Approved Answer
Step: 1 Unlock

Question Has Been Solved by an Expert!
Get step-by-step solutions from verified subject matter experts
Step: 2 Unlock
Step: 3 Unlock