

Question: Q 1 . ) The above graph shows five points on a firm's expansion path when the price of labor is $ 2 5 per
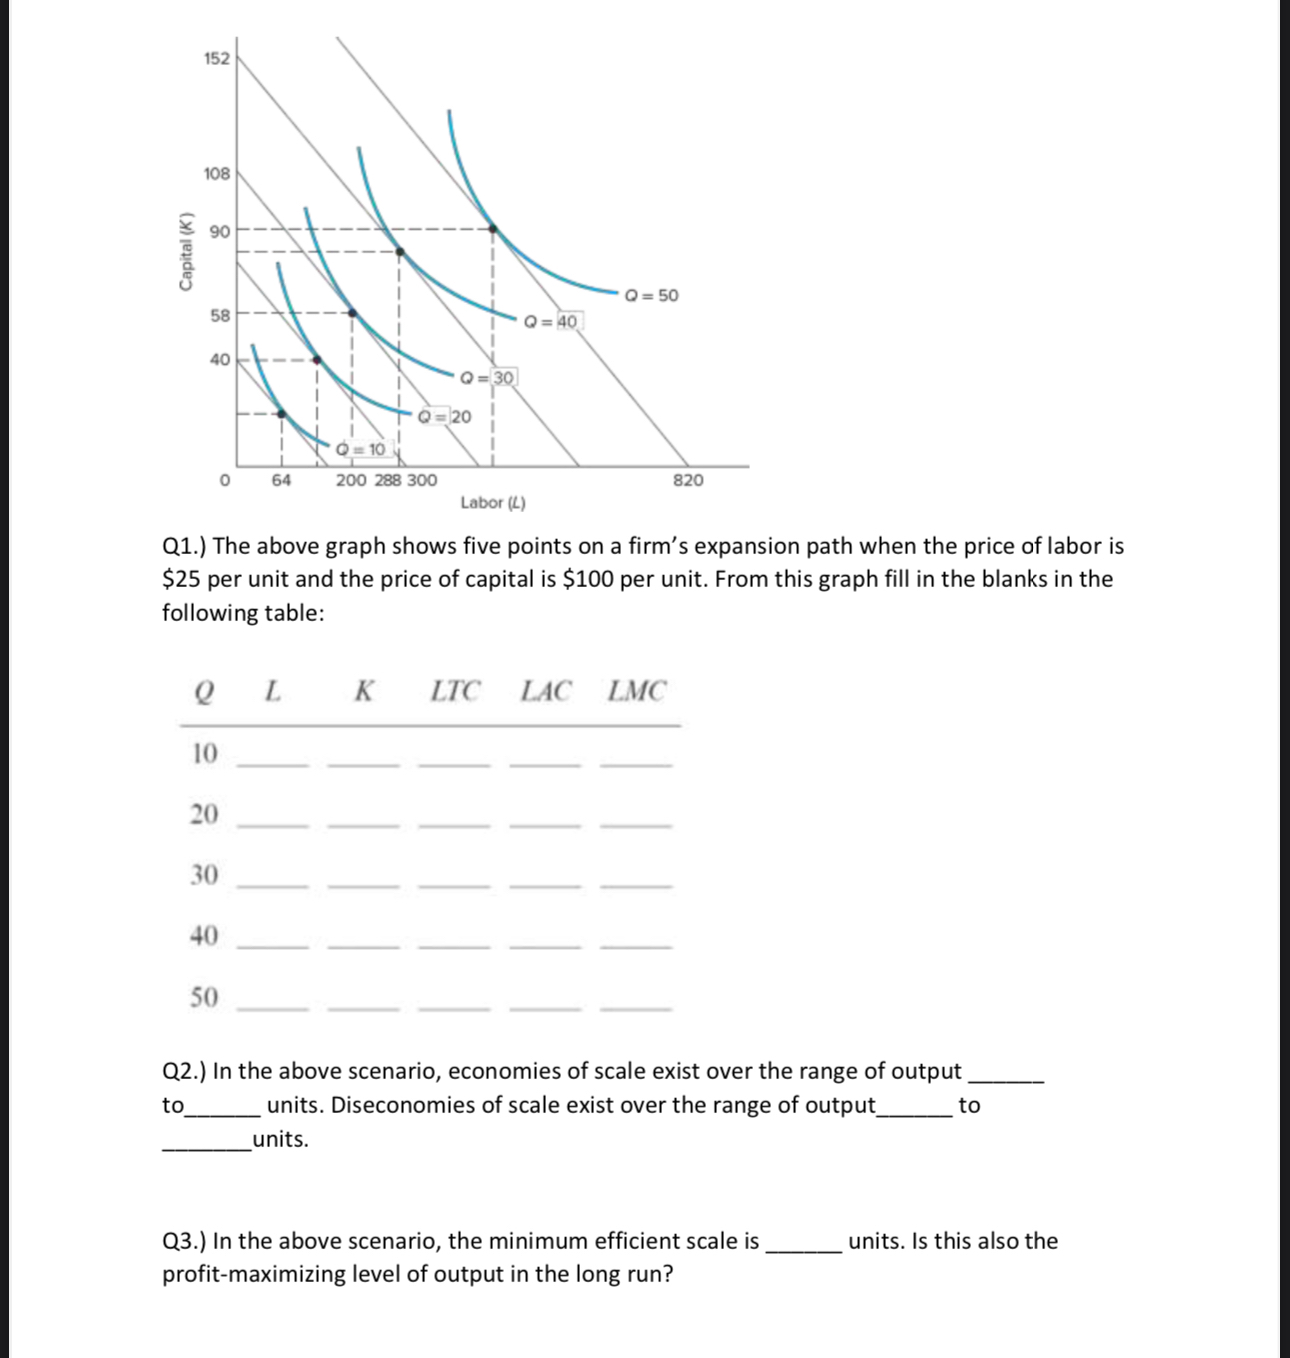
Q The above graph shows five points on a firm's expansion path when the price of labor is $ per unit and the price of capital is $ per unit. From this graph fill in the blanks in the following table:
tableQLKLTCLAC,LMC
Q In the above scenario, economies of scale exist over the range of output tc units. Diseconomies of scale exist over the range of output to units.
Q In the above scenario, the minimum efficient scale is units. Is this also the profitmaximizing level of output in the long run?
Step by Step Solution
There are 3 Steps involved in it
1 Expert Approved Answer
Step: 1 Unlock

Question Has Been Solved by an Expert!
Get step-by-step solutions from verified subject matter experts
Step: 2 Unlock
Step: 3 Unlock