

Question: Q . 1 The from - to chart below indicates the number of loads moved per 8 - hr day ( above the slash )
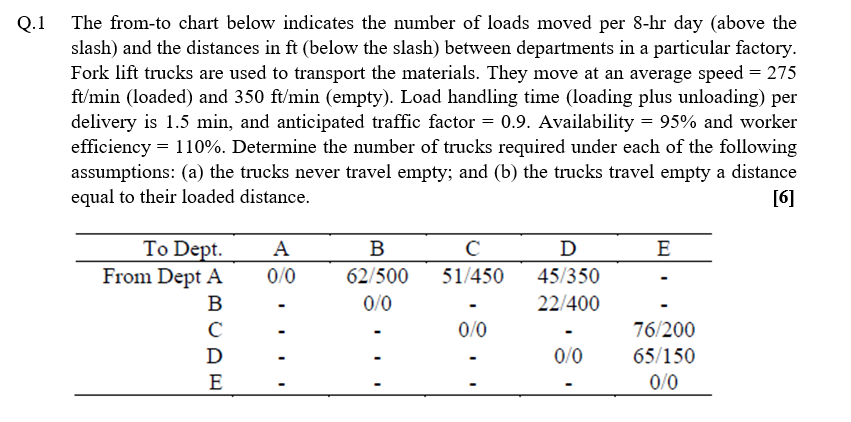
Q The fromto chart below indicates the number of loads moved per hr day above the slash and the distances in ft below the slash between departments in a particular factory. Fork lift trucks are used to transport the materials. They move at an average speed mathrmftmathrmminloaded and mathrmftmathrmminempty Load handling time loading plus unloading per delivery is min and anticipated traffic factor Availability and worker efficiency Determine the number of trucks required under each of the following assumptions: a the trucks never travel empty; and b the trucks travel empty a distance equal to their loaded distance.
Step by Step Solution
There are 3 Steps involved in it
1 Expert Approved Answer
Step: 1 Unlock

Question Has Been Solved by an Expert!
Get step-by-step solutions from verified subject matter experts
Step: 2 Unlock
Step: 3 Unlock