

Question: Q 1 . Use data.txt , which is posted under Course Materials. The first row of data.txt is the description for each column. Creat the
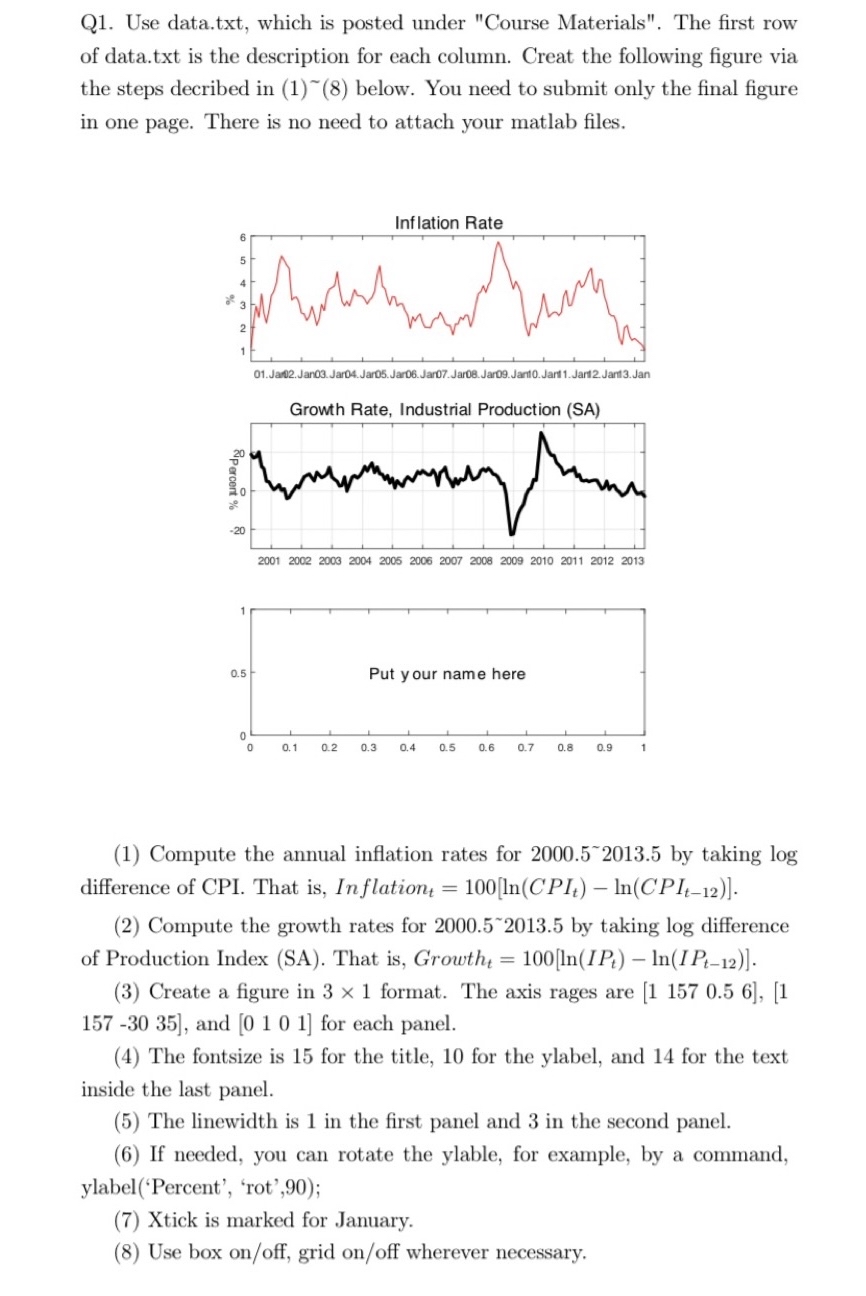
Q Use data.txt which is posted under "Course Materials". The first row of data.txt is the description for each column. Creat the following figure via the steps decribed in below. You need to submit only the final figure in one page. There is no need to attach your matlab files.
Compute the annual inflation rates for by taking log difference of CPI. That is In flation
Compute the growth rates for by taking log difference of Production Index SA That is Growth and for each panel.
The fontsize is for the title, for the ylabel, and for the text inside the last panel.
The linewidth is in the first panel and in the second panel.
If needed, you can rotate the ylable, for example, by a command, ylabelPercent 'rot',;
Xtick is marked for January.
Use box onoff grid onoff wherever necessary.
Step by Step Solution
There are 3 Steps involved in it
1 Expert Approved Answer
Step: 1 Unlock

Question Has Been Solved by an Expert!
Get step-by-step solutions from verified subject matter experts
Step: 2 Unlock
Step: 3 Unlock