

Question: Q . 1 : Where do we see data science? Give few examples with an explanation. Q . 2 : Differentiate between CSV and TSV
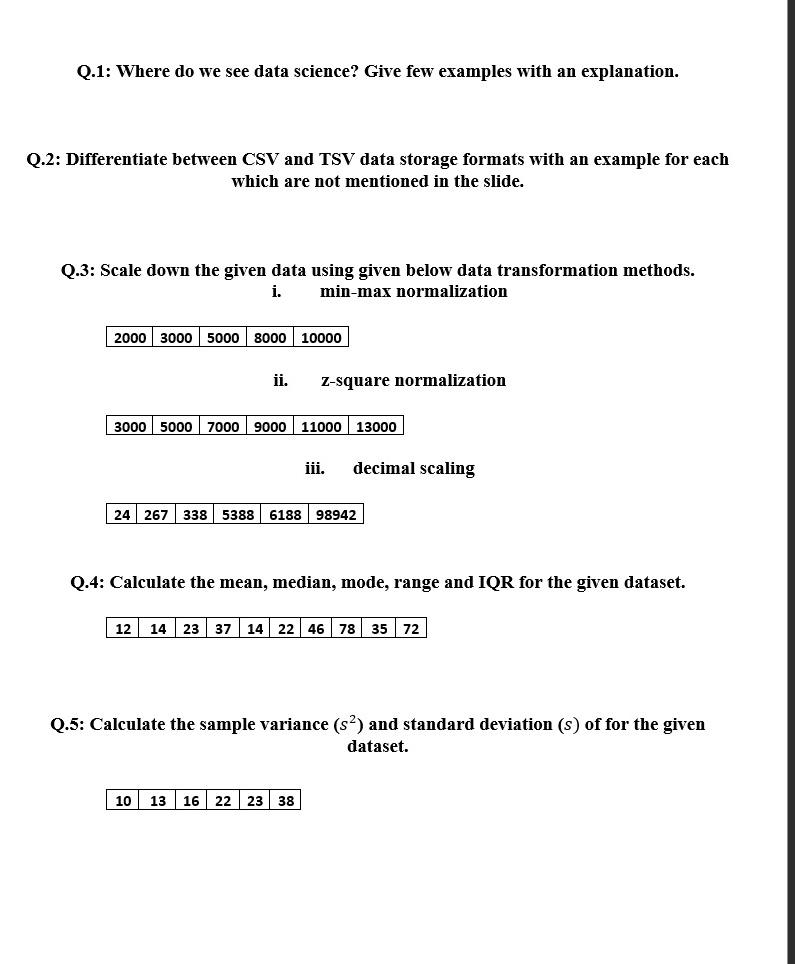
Q: Where do we see data science? Give few examples with an explanation.
Q: Differentiate between CSV and TSV data storage formats with an example for each which are not mentioned in the slide.
Q: Scale down the given data using given below data transformation methods.
i minmax normalization
table
ii zsquare normalization
table
iii. decimal scaling
table
Q: Calculate the mean, median, mode, range and IQR for the given dataset.
table
Q: Calculate the sample variance and standard deviation of for the given dataset.
table
Step by Step Solution
There are 3 Steps involved in it
1 Expert Approved Answer
Step: 1 Unlock

Question Has Been Solved by an Expert!
Get step-by-step solutions from verified subject matter experts
Step: 2 Unlock
Step: 3 Unlock